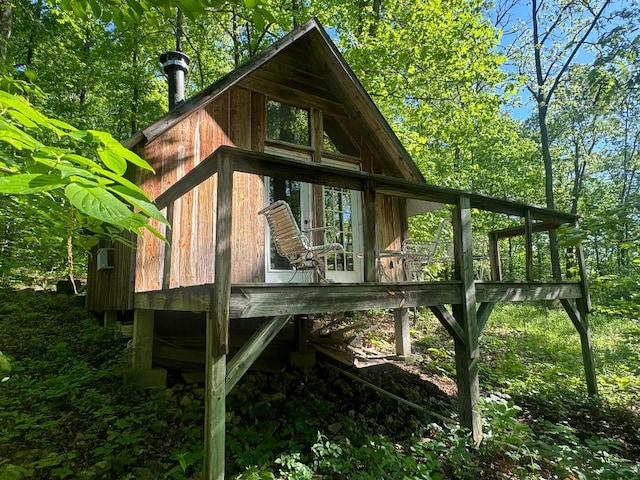
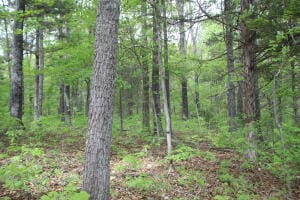
$1,651 Closing Credit¹
#H148947, Listing Office: New Heights Realty


How much do homes in Marble Falls Township, AR cost?
Based on all homes listed in January 2025
The list price of homes in Marble Falls Township has remained the same since December.
Summary: The median home list price in Marble Falls Township was $234,000 in January 2025, the same as the previous month, and the median price per square foot was $418.
| City | Dec 2024 | Jan 2025 | Change YoY |
|---|---|---|---|
| Marble Falls | $419.4K | $699.9K | +66.9% |
| Hasty Township | $379.9K | $379.9K | 0.0% |
| Marble Falls Township | $234K | $234K | 0.0% |
| Beds | Dec 2024 | Jan 2025 | Change YoY |
|---|---|---|---|
| 11 Bedroom | $139K | $139K | 0.0% |
| 22 Bedrooms | $466.9K | $466.9K | 0.0% |
| 33 Bedrooms | - | - | N/A |
| 44 Bedrooms | - | - | N/A |
| 55+ Bedrooms | - | - | N/A |
Summary: Marble Falls Township housing price by bedroom type for January 2025, compared to the previous year. The home price for 1 bedroom homes did not change. The home price for 2 bedroom homes did not change. The home price for 3 bedroom homes did not change. The home price for 4 bedroom homes did not change. The home price for 5 bedroom homes did not change.
How many homes are available in Marble Falls Township, AR?
| Last Month | 2 months ago | Change MoM |
|---|---|---|
| 3Last MonthJan 2025 | ||
| 32 months agoDec 2024 | 0.0 % Change MoMDec – Jan |
Summary: The Marble Falls Township real estate market had 3 homes for sale in Jan 2025, the same as Dec 2024
| Beds | Dec 2024 | Jan 2025 | Change MoM |
|---|---|---|---|
| 11 Bedroom | 1 | 1 | 0.0% |
| 22 Bedrooms | 2 | 2 | 0.0% |
| 33 Bedrooms | 0 | 0 | 0.0% |
| 44 Bedrooms | 0 | 0 | 0.0% |
| 55+ Bedrooms | 0 | 0 | 0.0% |
Summary: Marble Falls Township housing inventory by bedroom type for January 2025, compared to the previous month. The inventory for 1 bedroom homes remained the same. The inventory for 2 bedroom homes remained the same. The inventory for 3 bedroom homes remained the same. The inventory for 4 bedroom homes remained the same. The inventory for 5 bedroom homes remained the same.
How much do homes in Marble Falls Township, AR cost?
Over Asking Price0 Home
At Asking Price1 Home
Under Asking Price0 Home
If you're buying a home in Marble Falls Township, expect to pay close to the asking price. 100% of homes here sold near the asking price last month.
Summary: A total of 1 homes were sold or pending in Marble Falls Township in January 2025, up by 100.0% month-over-month. Of the 1 sold homes, 0% were sold under asking, 100% were sold at asking, and and 0% were sold over asking.
How long does it take to sell a home in Marble Falls Township, AR?
Under 30 Days0 Home
30 – 90 Days0 Home
Over 90 Days1 Home
Most homes in Marble Falls Township are taking a long time to sell, it's a good idea to negotiate on homes here.
Summary: During January 2025, 1 homes were sold in Marble Falls Township; 0% of homes were sold within 30 days, 0% of homes were sold within 30 to 90 days, and 100% of homes were sold over 90 days.
| Last Month | 1 month ago | Change MoM |
|---|---|---|
| 194 DaysLast MonthJan 2025 | ||
| 173 Days1 month agoDec 2024 | +11.9 % Change MoMDec – Jan |
Summary: Homes in Marble Falls Township had an average listing age of 194 days in Jan 2025, up by 11.9% compared to the previous month.
Connect With An Agent
Local real estate agents are ready to help you find a home here
Sell My Home
Sell your home with an expert or get the job done on your own.
Get Approved
Get a customizable mortgage solution based on today's rates.
What homes are available in Marble Falls Township, AR?
#H148947, Listing Office: New Heights Realty
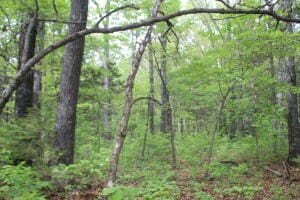
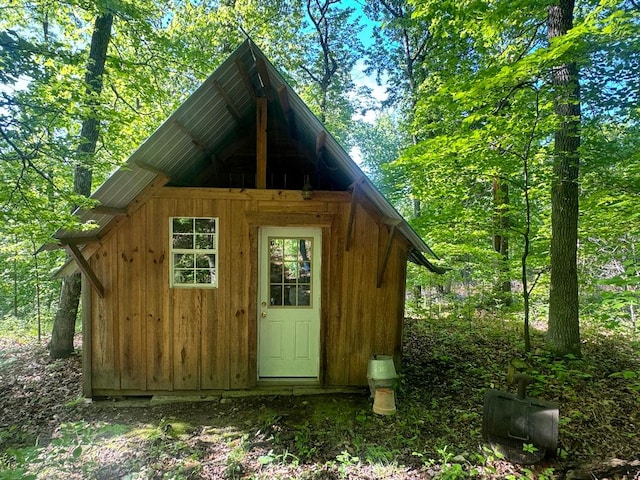
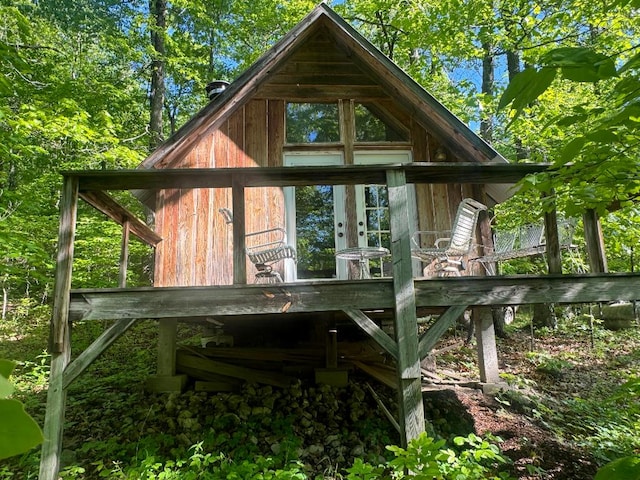
#H148776, Listing Office: Harp & Associates Real Es

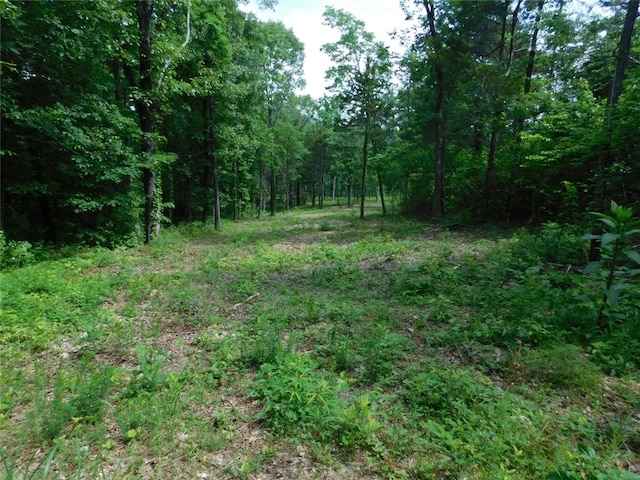
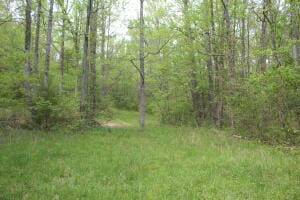
#1246431, Listing Office: United Country Property Connections
Nearby markets aren't available for Marble Falls Township, AR
Based on information from Northwest Arkansas Board of Realtors MLS / Arkansas Regional MLS LLC, for the period 12/01/2024 - 02/01/2025
 Disclaimer: IDX information is provided exclusively for consumers’ personal, non-commercial use, that it may not be used for any purpose other than to identify prospective properties consumers may be interested in purchasing, and that the data is deemed reliable but is not guaranteed accurate by the MLS. Copyright © 2025 Northwest Arkansas Board of Realtors All rights reserved.