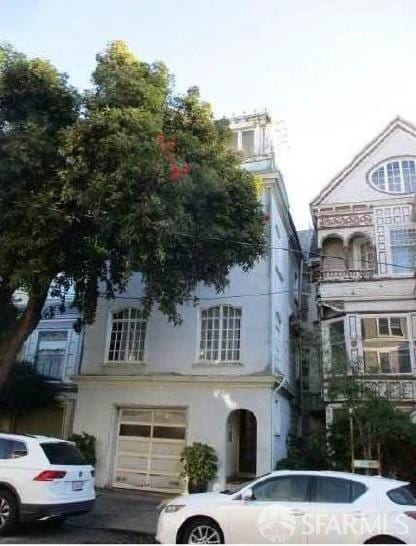

#425048533, Non - Member, Listing office: Recip. Listing (MLS Only)


How much do homes in North of Panhandle (NoPa), CA cost?
Is North of Panhandle (NoPa), CA a buyer’s or seller’s market?
Seller'sMarket
Buyer'sMarket
North of Panhandle (NoPa) is a Seller's Market
Difference Since June 2024
Since last year, North of Panhandle (NoPa) has remained a Seller's Market.
North of Panhandle (NoPa) is a Sellers Housing Market, which means prices tend to be higher and homes sell faster.
Based on all homes sold in the last 12 months
Homes in North of Panhandle (NoPa) have sold for 6.2% less than they did a year ago.
Summary: The median home sold price in North of Panhandle (NoPa) was $1,496,000 in June 2025, down 6.2% from last year, and the median price per square foot was $1,023.
| City | Jun 2024 | Jun 2025 | Change YoY |
|---|---|---|---|
| Lone Mountain | $1.6M | $1.7M | +8.1% |
| Haight-Ashbury | $1.7M | $1.6M | -3.5% |
| North of Panhandle (NoPa) | $1.5M | $1.4M | -6.2% |
| Beds | Jun 2024 | Jun 2025 | Change YoY |
|---|---|---|---|
| 11 Bedroom | $666K | $815K | +22.4% |
| 22 Bedrooms | $1.1M | $1.3M | +16.1% |
| 33 Bedrooms | $1.6M | $1.7M | +3.2% |
| 44 Bedrooms | $1.8M | $2.2M | +21.2% |
| 55+ Bedrooms | $2.5M | $2.5M | -0.4% |
Summary: North of Panhandle (NoPa) housing price by bedroom type for June 2025, compared to the previous year. The home price for 1 bedroom homes increased by +22.4%. The home price for 2 bedroom homes increased by +16.1%. The home price for 3 bedroom homes increased by +3.2%. The home price for 4 bedroom homes increased by +21.2%. The home price for 5 bedroom homes decreased by -0.4%.
Market comparison tool
Data and numbers shown are subject to change and may vary based on different timeframes.
North of Panhandle (NoPa), CA
How many homes are available in North of Panhandle (NoPa), CA?
| Last Month | 2 months ago | Change MoM |
|---|---|---|
| 12Last MonthJun 2025 | ||
| 172 months agoMay 2025 | -29.4 % Change MoMMay – Jun |
Summary: The North of Panhandle (NoPa) real estate market had 12 homes for sale in Jun 2025, a 29.4 % decrease compared to May 2025.
| Last Month | 2 months ago | Change MoM |
|---|---|---|
| 3Last MonthJun 2025 | ||
| 72 months agoMay 2025 | -57.1 % Change MoMMay – Jun |
| Beds | May 2025 | Jun 2025 | Change MoM |
|---|---|---|---|
| 11 Bedroom | 1 | 1 | 0.0% |
| 22 Bedrooms | 6 | 4 | -33.3% |
| 33 Bedrooms | 4 | 3 | -25.0% |
| 44 Bedrooms | 3 | 2 | -33.3% |
| 55+ Bedrooms | 3 | 2 | -33.3% |
Summary: North of Panhandle (NoPa) housing inventory by bedroom type for June 2025, compared to the previous month. The inventory for 1 bedroom homes remained the same. The inventory for 2 bedroom homes decreased by -33.3%. The inventory for 3 bedroom homes decreased by -25.0%. The inventory for 4 bedroom homes decreased by -33.3%. The inventory for 5 bedroom homes decreased by -33.3%.
How much do homes in North of Panhandle (NoPa), CA cost?
Over Asking Price2 Homes
At Asking Price0 Home
Under Asking Price1 Home
If you're buying a home in North of Panhandle (NoPa), you could pay more than the asking price. 66.7% of homes here sold above asking price last month.
Summary: A total of 3 homes were sold or pending in North of Panhandle (NoPa) in June 2025, down by 57.1% month-over-month. Of the 3 sold homes, 33% were sold under asking, 0% were sold at asking, and and 67% were sold over asking.
How long does it take to sell a home in North of Panhandle (NoPa), CA?
Under 30 Days1 Home
30 – 90 Days2 Homes
Over 90 Days0 Home
Avg time on Rocket Homes in North of Panhandle (NoPa) has remained consistent over time.
Summary: During June 2025, 3 homes were sold in North of Panhandle (NoPa); 33% of homes were sold within 30 days, 67% of homes were sold within 30 to 90 days, and 0% of homes were sold over 90 days.
| This Year | 1 year ago | Change YoY |
|---|---|---|
| 28 DaysThis YearJun 2025 | ||
| 22 Days1 year agoJun 2024 | +28.8 % Change YoYJun 2024 – Jun 2025 |
Summary: Homes in North of Panhandle (NoPa) had an average listing age of 28 days in Jun 2025, up by 28.8% compared to the previous year.
Connect With An Agent
Local real estate agents are ready to help you find a home here
Sell My Home
Sell your home with an expert or get the job done on your own.
Get Approved
Get a customizable mortgage solution based on today's rates.
What homes are available in North of Panhandle (NoPa), CA?
#425048533, Non - Member, Listing office: Recip. Listing (MLS Only)
#SB25113140, Charles Rim, Listing office: United Pacific Investments Inc
#425030352, Makras Makras, Shahin B Garibaldi, Listing office: Makras Real Estate
#425026042, Luba Muzichenko, Listing office: Vanguard Properties
#425017730, Carter Waite, Listing office: Compass
#425005243, Jason C Chan, Julie Y Chan, Listing office: BarbCo
Nearby markets aren't available for North of Panhandle (NoPa), CA
Based on information from San Francisco MLS, and California Regional MLS for the period 07/01/2023 - 07/01/2025
 Listings on this page identified as belonging to another listing firm are based upon data obtained from the SFAR MLS, which data is copyrighted by the San Francisco Association of REALTORS©, but is not warranted. IDX information is provided exclusively for consumers' personal, non-commercial use and may not be used for any purpose other than to identify prospective properties consumers may be interested in purchasing. Listing Broker has attempted to offer accurate data, but buyers are advised to confirm all data provided. All data, including all measurements and calculations of area, is obtained from various sources and has not been, and will not be, verified by broker or MLS. All information should be independently reviewed and verified for accuracy. Properties may or may not be listed by the office/agent presenting the information.
  Based on information from California Regional Multiple Listing Service, Inc. and /or other sources. All data, including all measurements and calculations of area, is obtained from various sources and has not been, and will not be, verified by broker or MLS. All information should be independently reviewed and verified for accuracy. The data contained herein is copyrighted by CRMLS and is protected by all applicable copyright laws. Any dissemination of this information is in violation of copyright laws and is strictly prohibited.