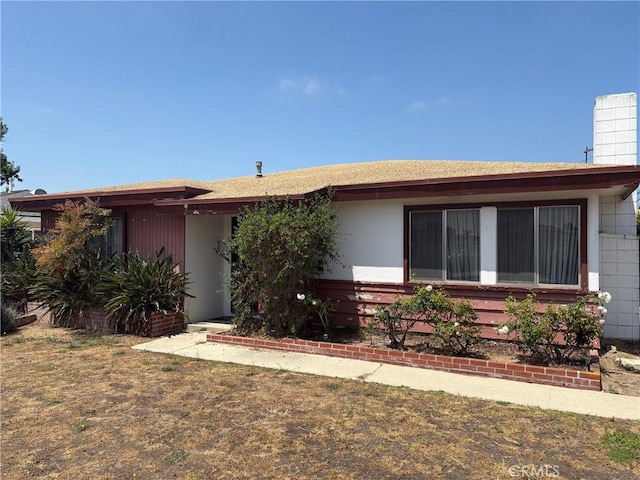
7 days on Rocket

#PV25152495, Veronica Xu, Listing office: Vista Sotheby's International Realty


How much do homes in West Torrance, CA cost?
Is West Torrance, CA a buyer’s or seller’s market?
Seller'sMarket
Buyer'sMarket
West Torrance is a Seller's Market
Difference Since June 2024
Since last year, West Torrance has remained a Seller's Market.
West Torrance is a Sellers Housing Market, which means prices tend to be higher and homes sell faster.
Based on all homes sold in the last 12 months
Homes in West Torrance have sold for 13.7% more than they did a year ago.
Summary: The median home sold price in West Torrance was $1,477,500 in June 2025, up 13.7% from last year, and the median price per square foot was $877.
| City | Jun 2024 | Jun 2025 | Change YoY |
|---|---|---|---|
| West Torrance | $1.3M | $1.4M | +13.7% |
| Central Torrance | $940K | $1.0M | +10.0% |
| South Bay | $1.2M | $1.3M | +5.9% |
| S. Redondo Beach N. of Torrance Blvd. | $1.5M | $1.5M | +1.9% |
| Beds | Jun 2024 | Jun 2025 | Change YoY |
|---|---|---|---|
| 11 Bedroom | - | - | N/A |
| 22 Bedrooms | $955K | $739K | -22.6% |
| 33 Bedrooms | $1.2M | $1.4M | +10.4% |
| 44 Bedrooms | $1.5M | $1.6M | +5.1% |
| 55+ Bedrooms | $1.6M | $1.7M | +9.3% |
Summary: West Torrance housing price by bedroom type for June 2025, compared to the previous year. The home price for 1 bedroom homes did not change. The home price for 2 bedroom homes decreased by -22.6%. The home price for 3 bedroom homes increased by +10.4%. The home price for 4 bedroom homes increased by +5.1%. The home price for 5 bedroom homes increased by +9.3%.
Market comparison tool
Data and numbers shown are subject to change and may vary based on different timeframes.
West Torrance, CA
How many homes are available in West Torrance, CA?
| Last Month | 2 months ago | Change MoM |
|---|---|---|
| 28Last MonthJun 2025 | ||
| 252 months agoMay 2025 | +12.0 % Change MoMMay – Jun |
Summary: The West Torrance real estate market had 28 homes for sale in Jun 2025, a 12.0 % increase compared to May 2025.
| Last Month | 2 months ago | Change MoM |
|---|---|---|
| 9Last MonthJun 2025 | ||
| 62 months agoMay 2025 | +50.0 % Change MoMMay – Jun |
| Beds | May 2025 | Jun 2025 | Change MoM |
|---|---|---|---|
| 11 Bedroom | 0 | 0 | 0.0% |
| 22 Bedrooms | 3 | 3 | 0.0% |
| 33 Bedrooms | 10 | 14 | +40.0% |
| 44 Bedrooms | 10 | 9 | -10.0% |
| 55+ Bedrooms | 2 | 2 | 0.0% |
Summary: West Torrance housing inventory by bedroom type for June 2025, compared to the previous month. The inventory for 1 bedroom homes remained the same. The inventory for 2 bedroom homes remained the same. The inventory for 3 bedroom homes increased by +40.0%. The inventory for 4 bedroom homes decreased by -10.0%. The inventory for 5 bedroom homes remained the same.
How much do homes in West Torrance, CA cost?
Over Asking Price3 Homes
At Asking Price2 Homes
Under Asking Price4 Homes
If you're buying a home in West Torrance, you may be able to get a good deal. 44.4% of homes here sold below asking price last month.
Summary: A total of 9 homes were sold or pending in West Torrance in June 2025, up by 50.0% month-over-month. Of the 9 sold homes, 44% were sold under asking, 22% were sold at asking, and and 33% were sold over asking.
How long does it take to sell a home in West Torrance, CA?
Under 30 Days7 Homes
30 – 90 Days2 Homes
Over 90 Days0 Home
Many homes in West Torrance are selling fast, if you're buying plan to act quickly.
Summary: During June 2025, 9 homes were sold in West Torrance; 78% of homes were sold within 30 days, 22% of homes were sold within 30 to 90 days, and 0% of homes were sold over 90 days.
| This Year | 1 year ago | Change YoY |
|---|---|---|
| 22 DaysThis YearJun 2025 | ||
| 7 Days1 year agoJun 2024 | +210.1 % Change YoYJun 2024 – Jun 2025 |
Summary: Homes in West Torrance had an average listing age of 22 days in Jun 2025, up by 210.1% compared to the previous year.
Connect With An Agent
Local real estate agents are ready to help you find a home here
Sell My Home
Sell your home with an expert or get the job done on your own.
Get Approved
Get a customizable mortgage solution based on today's rates.
What homes are available in West Torrance, CA?
#PV25152495, Veronica Xu, Listing office: Vista Sotheby's International Realty
#SB25146003, Susan Earnest, Listing office: Peninsula Realty, Inc.
#SB25065943, J. Gregory Maffei, Listing office: Vista Sotheby’s International Realty
#SB25148333, Jo Ann Van Leuven, Listing office: Estate Properties
#PV25142914, Gayle Probst, Listing office: Estate Properties
#SB25142869, Nicholas Schneider, Listing office: Compass
#SB25126211, Raymond Millman, Listing office: Compass
#IG25135997, Lindsey Shortland, Listing office: Keller Williams Realty
#PW25131930, David Montgomery, Listing office: Montgomery & Associates R.E.
#PV25124218, Trina Gagliano, Listing office: Vista Sotheby's International Realty

#IG25123618, Danny Webster, Listing office: Dynasty Real Estate
#SB25118271, Nicole Reis, Listing office: Compass
Based on information from California Regional MLS, for the period 07/01/2023 - 07/01/2025
 Based on information from California Regional Multiple Listing Service, Inc. and /or other sources. All data, including all measurements and calculations of area, is obtained from various sources and has not been, and will not be, verified by broker or MLS. All information should be independently reviewed and verified for accuracy. The data contained herein is copyrighted by CRMLS and is protected by all applicable copyright laws. Any dissemination of this information is in violation of copyright laws and is strictly prohibited.