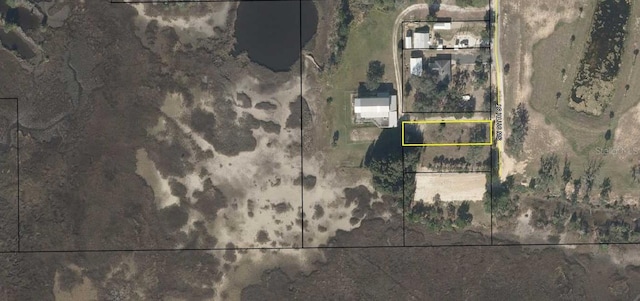
3 days on Rocket

#GC532897, Mark McEntire, PA, Listing office: HOMETOWN REALTY OF NORTH FLORIDA, INC


How much do homes in Cross City South, FL cost?
Based on all homes listed in the last 12 months
The list price of homes in Cross City South has increased by 35.1% since last year.
Summary: The median home list price in Cross City South was $385,000 in July 2025, up 35.1% from the previous year, and the median price per square foot was $245.
| City | Jul 2024 | Jul 2025 | Change YoY |
|---|---|---|---|
| Old Town | $202K | $332.5K | +64.6% |
| Cross City South | $285K | $385K | +35.1% |
| Cross City North | $179.7K | $221K | +23.0% |
| Fanning Springs | $326.4K | $330.2K | +1.2% |
| Beds | Jul 2024 | Jul 2025 | Change YoY |
|---|---|---|---|
| 11 Bedroom | $249.9K | $169K | -32.4% |
| 22 Bedrooms | $250K | $289.9K | +16.0% |
| 33 Bedrooms | $287.4K | $435K | +51.3% |
| 44 Bedrooms | $344.9K | $385K | +11.6% |
| 55+ Bedrooms | - | $1.1M | N/A |
Summary: Cross City South housing price by bedroom type for July 2025, compared to the previous year. The home price for 1 bedroom homes decreased by -32.4%. The home price for 2 bedroom homes increased by +16.0%. The home price for 3 bedroom homes increased by +51.3%. The home price for 4 bedroom homes increased by +11.6%. The home price for 5 bedroom homes did not change.
Market comparison tool
Data and numbers shown are subject to change and may vary based on different timeframes.
Cross City South, FL
How many homes are available in Cross City South, FL?
| Last Month | 2 months ago | Change MoM |
|---|---|---|
| 11Last MonthJul 2025 | ||
| 82 months agoJun 2025 | +37.5 % Change MoMJun – Jul |
Summary: The Cross City South real estate market had 11 homes for sale in Jul 2025, a 37.5 % increase compared to Jun 2025.
| Beds | Jun 2025 | Jul 2025 | Change MoM |
|---|---|---|---|
| 11 Bedroom | 2 | 2 | 0.0% |
| 22 Bedrooms | 1 | 3 | +200.0% |
| 33 Bedrooms | 4 | 5 | +25.0% |
| 44 Bedrooms | 0 | 0 | 0.0% |
| 55+ Bedrooms | 1 | 1 | 0.0% |
Summary: Cross City South housing inventory by bedroom type for July 2025, compared to the previous month. The inventory for 1 bedroom homes remained the same. The inventory for 2 bedroom homes increased by +200.0%. The inventory for 3 bedroom homes increased by +25.0%. The inventory for 4 bedroom homes remained the same. The inventory for 5 bedroom homes remained the same.
How long does it take to sell a home in Cross City South, FL?
| This Year | 1 year ago | Change YoY |
|---|---|---|
| 199 DaysThis YearJul 2025 | ||
| 17 Days1 year agoJul 2024 | +1071.7 % Change YoYJul 2024 – Jul 2025 |
Summary: Homes in Cross City South had an average listing age of 199 days in Jul 2025, up by 1071.7% compared to the previous year.
Connect With An Agent
Local real estate agents are ready to help you find a home here
Sell My Home
Sell your home with an expert or get the job done on your own.
Get Approved
Get a customizable mortgage solution based on today's rates.
What homes are available in Cross City South, FL?
#GC532897, Mark McEntire, PA, Listing office: HOMETOWN REALTY OF NORTH FLORIDA, INC
#GC532326, Brad Smith, Listing office: UNITED COUNTRY SMITH & ASSOCIATES - NEWBERRY
#GC532324, Brad Smith, Listing office: UNITED COUNTRY SMITH & ASSOCIATES - NEWBERRY
#GC532274, Brad Smith, Listing office: UNITED COUNTRY SMITH & ASSOCIATES - NEWBERRY
#OM704403, Scott Archibald, Listing office: HOMERUN REALTY
#TB8400209, Wendy Nash Hickman PA, Listing office: CENTURY 21 RE CHAMPIONS
#W7875998, Melinda Grimes, Listing office: BRIDGE POINT BUSINESS REAL EST
#GC530876, Burgandy Arrington, Listing office: HATCHER REALTY SERVICES, INC.
#385955, Listing office: Focus Real Estate Group, Inc
#GC530518, Burgandy Arrington, Listing office: HATCHER REALTY SERVICES, INC.
#2085299, COURTNEY MCQUAIG, Listing office: MAXREV, LLC
#G5096435, Clarissa Rainey, Listing office: ERA GRIZZARD REAL ESTATE
Based on information from Stellar MLS, realMLS, Hernando County Information Services MLS, and Capital Area Technology & REALTOR Services Inc. for the period 08/01/2023 - 08/01/2025
 Listings courtesy of Stellar MLS as distributed by MLS GRID.
 Copyright 2025 My Florida Regional Multiple Listing Service DBA Stellar MLS. The real estate listing data marked with this icon comes from the IDX program of the Stellar MLS system. All information provided is deemed reliable but is not guaranteed and should be independently verified. Listings displayed on this website may be subject to prior sale or removal from sale; availability of any listing should always be independently verified. Listing information is provided exclusively for consumers’ personal, non-commercial use, solely to identify potential properties for potential purchase; all other use is strictly prohibited and may violate relevant federal and state law. Properties displayed may be listed or sold by various participants in the MLS.
 The information contained herein has been provided by by Hernando County Association of REALTORS®. This information is from sources deemed reliable but not guaranteed. The information is for consumers' personal, non-commerical use and may not be used for any purpose other than identifying properties which consumers may be interested in purchasing. The information contained in this web site is believed to be reliable and while every effort is made to assure that the information is as accurate as possible, the owner of this site disclaims any implied warranty or representation about it's accuracy, completeness or appropriateness for any particular purpose. This includes but is not limited to information provided by any third party which is accessed through this site via a hyperlink. Those persons who access this information assume full responsibility for the use of said information and understand and agree that the owner of this site named above not responsible or liable for any claim, loss or damage arising from the use of any information contained in this site. Any reference to specific products, companies or services does not necessarily constitute or imply recommendation or endorsement by the owner of this site.