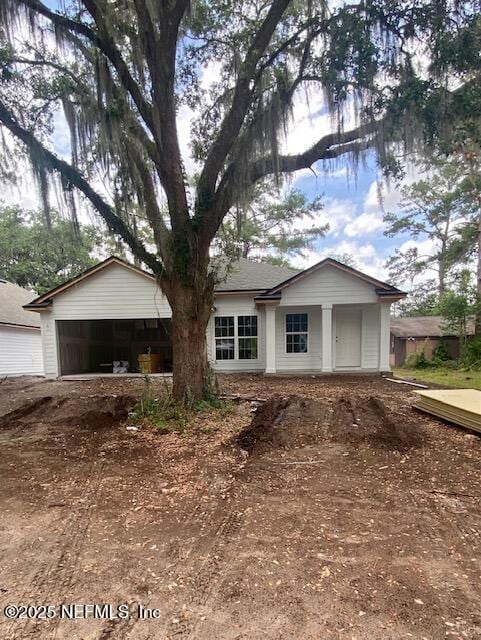
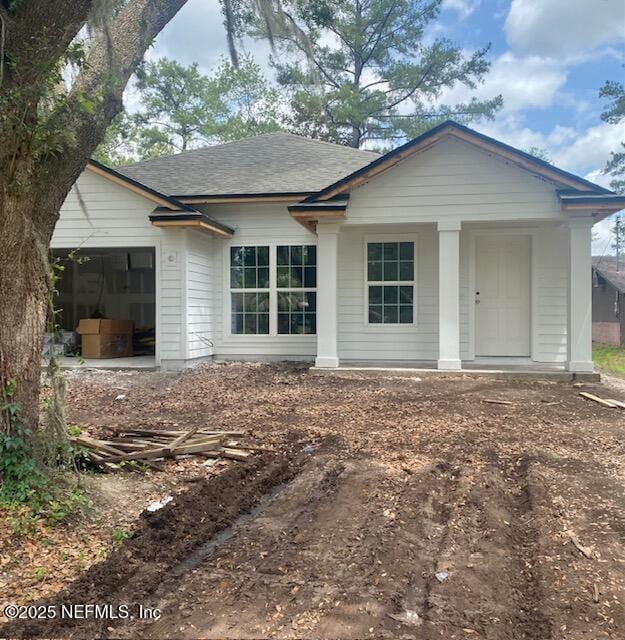
3 days on Rocket
#2098934, STEPHEN DESANTO, Listing office: COLDWELL BANKER VANGUARD REALTY


How much do homes in Herlong, FL cost?
Is Herlong, FL a buyer’s or seller’s market?
Seller'sMarket
Buyer'sMarket
Herlong is a Seller's Market
Difference Since June 2024
Since last year, Herlong has remained a Seller's Market.
Herlong is a Sellers Housing Market, which means prices tend to be higher and homes sell faster.
Based on all homes sold in the last 12 months
The sold price of homes in Herlong has remained the same since last year.
Summary: The median home sold price in Herlong was $284,000 in June 2025, up 0.4% from last year, and the median price per square foot was $174.
| City | Jun 2024 | Jun 2025 | Change YoY |
|---|---|---|---|
| Springtree Village | $275K | $279.9K | +1.8% |
| Herlong | $283K | $284K | 0.4% |
| Beds | Jun 2024 | Jun 2025 | Change YoY |
|---|---|---|---|
| 11 Bedroom | - | - | N/A |
| 22 Bedrooms | $241.2K | - | N/A |
| 33 Bedrooms | $275K | $274.7K | -0.1% |
| 44 Bedrooms | $310K | $298.4K | -3.7% |
| 55+ Bedrooms | $275K | - | N/A |
Summary: Herlong housing price by bedroom type for June 2025, compared to the previous year. The home price for 1 bedroom homes did not change. The home price for 2 bedroom homes did not change. The home price for 3 bedroom homes decreased by -0.1%. The home price for 4 bedroom homes decreased by -3.7%. The home price for 5 bedroom homes did not change.
Market comparison tool
Data and numbers shown are subject to change and may vary based on different timeframes.
Herlong, FL
How many homes are available in Herlong, FL?
| Last Month | 2 months ago | Change MoM |
|---|---|---|
| 45Last MonthJun 2025 | ||
| 412 months agoMay 2025 | +9.8 % Change MoMMay – Jun |
Summary: The Herlong real estate market had 45 homes for sale in Jun 2025, a 9.8 % increase compared to May 2025.
| Last Month | 2 months ago | Change MoM |
|---|---|---|
| 12Last MonthJun 2025 | ||
| 82 months agoMay 2025 | +50.0 % Change MoMMay – Jun |
| Beds | May 2025 | Jun 2025 | Change MoM |
|---|---|---|---|
| 11 Bedroom | 0 | 0 | 0.0% |
| 22 Bedrooms | 1 | 1 | 0.0% |
| 33 Bedrooms | 27 | 29 | +7.4% |
| 44 Bedrooms | 12 | 14 | +16.7% |
| 55+ Bedrooms | 1 | 1 | 0.0% |
Summary: Herlong housing inventory by bedroom type for June 2025, compared to the previous month. The inventory for 1 bedroom homes remained the same. The inventory for 2 bedroom homes remained the same. The inventory for 3 bedroom homes increased by +7.4%. The inventory for 4 bedroom homes increased by +16.7%. The inventory for 5 bedroom homes remained the same.
How much do homes in Herlong, FL cost?
Over Asking Price1 Home
At Asking Price5 Homes
Under Asking Price6 Homes
If you're buying a home in Herlong, you may be able to get a good deal. 50% of homes here sold below asking price last month.
Summary: A total of 12 homes were sold or pending in Herlong in June 2025, up by 50.0% month-over-month. Of the 12 sold homes, 50% were sold under asking, 42% were sold at asking, and and 8% were sold over asking.
How long does it take to sell a home in Herlong, FL?
Under 30 Days10 Homes
30 – 90 Days0 Home
Over 90 Days2 Homes
Many homes in Herlong are selling fast, if you're buying plan to act quickly.
Summary: During June 2025, 12 homes were sold in Herlong; 83% of homes were sold within 30 days, 0% of homes were sold within 30 to 90 days, and 17% of homes were sold over 90 days.
| This Year | 1 year ago | Change YoY |
|---|---|---|
| 23 DaysThis YearJun 2025 | ||
| 46 Days1 year agoJun 2024 | -50.0 % Change YoYJun 2024 – Jun 2025 |
Summary: Homes in Herlong had an average listing age of 23 days in Jun 2025, down by 50.0% compared to the previous year.
Connect With An Agent
Local real estate agents are ready to help you find a home here
Sell My Home
Sell your home with an expert or get the job done on your own.
Get Approved
Get a customizable mortgage solution based on today's rates.
What homes are available in Herlong, FL?
#2098934, STEPHEN DESANTO, Listing office: COLDWELL BANKER VANGUARD REALTY
#S5130017, Rudy Morales, PA, Listing office: LA ROSA REALTY LLC
#2095064, AMIR LAVI, Listing office: BICHACHI REALTY PLLC
#2094961, MISHELL LARMOND, Listing office: JPAR CITY AND BEACH
#2094529, JENNIFER SOLOMON, Listing office: WATSON REALTY CORP
#2093436, HEATHER LINDSTAM, Listing office: UNITED REAL ESTATE GALLERY
#2093393, KRISTINE MICHELE HAMILTON, Listing office: ROUND TABLE REALTY
#2092708, BLAKE ALAN KEATHLEY, Listing office: EVERYSTATE INC
#2092686, KATHY TOWERS, Listing office: SOUTHEAST ATLANTIC REALTY
#2092543, KATHY TOWERS, Listing office: SOUTHEAST ATLANTIC REALTY
#2091559, KAYELAN ANDERSON, Listing office: HERRON REAL ESTATE LLC
#2089569, SUSAN KENNEDY, Listing office: COLDWELL BANKER VANGUARD REALTY
Based on information from realMLS, and Stellar MLS for the period 07/01/2023 - 07/01/2025
 Listings courtesy of Stellar MLS as distributed by MLS GRID.
 Copyright 2025 My Florida Regional Multiple Listing Service DBA Stellar MLS. The real estate listing data marked with this icon comes from the IDX program of the Stellar MLS system. All information provided is deemed reliable but is not guaranteed and should be independently verified. Listings displayed on this website may be subject to prior sale or removal from sale; availability of any listing should always be independently verified. Listing information is provided exclusively for consumers’ personal, non-commercial use, solely to identify potential properties for potential purchase; all other use is strictly prohibited and may violate relevant federal and state law. Properties displayed may be listed or sold by various participants in the MLS.