5 hours on Rocket

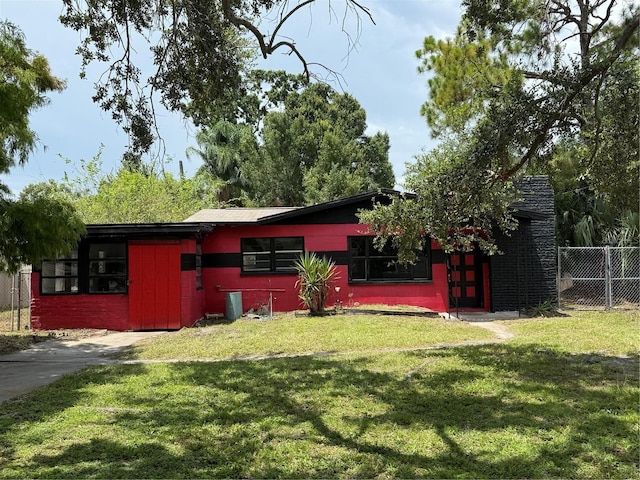
#TB8409649, Alarico Fernandez, Listing office: SOLEI INTERNATIONAL REALTY LLC


How much do homes in South Tampa, FL cost?
Is South Tampa, FL a buyer’s or seller’s market?
Seller'sMarket
Buyer'sMarket
South Tampa is a Neutral Market
Difference Since June 2024
At the same time last year, South Tampa was a Seller's Market.
South Tampa is a Neutral Housing Market, which means prices tend to be reasonable and homes stay on the market for a typical length of time.
Based on all homes sold in the last 12 months
Homes in South Tampa have sold for 2.3% more than they did a year ago.
Summary: The median home sold price in South Tampa was $700,000 in June 2025, up 2.3% from last year, and the median price per square foot was $378.
| City | Jun 2024 | Jun 2025 | Change YoY |
|---|---|---|---|
| Bayside West | $385K | $398.9K | +3.6% |
| South Tampa | $684K | $700K | +2.3% |
| Fair Oaks / Manhattan Manor | $322K | $307K | -4.7% |
| Bel Mar Gardens | $960K | $620K | -35.4% |
| Beds | Jun 2024 | Jun 2025 | Change YoY |
|---|---|---|---|
| 11 Bedroom | $233.4K | $229.5K | -1.7% |
| 22 Bedrooms | $399.5K | $393K | -1.6% |
| 33 Bedrooms | $625K | $615K | -1.6% |
| 44 Bedrooms | $950K | $975K | +2.6% |
| 55+ Bedrooms | $1.8M | $2.1M | +12.7% |
Summary: South Tampa housing price by bedroom type for June 2025, compared to the previous year. The home price for 1 bedroom homes decreased by -1.7%. The home price for 2 bedroom homes decreased by -1.6%. The home price for 3 bedroom homes decreased by -1.6%. The home price for 4 bedroom homes increased by +2.6%. The home price for 5 bedroom homes increased by +12.7%.
Market comparison tool
Data and numbers shown are subject to change and may vary based on different timeframes.
South Tampa, FL
How many homes are available in South Tampa, FL?
| Last Month | 2 months ago | Change MoM |
|---|---|---|
| 1,141Last MonthJun 2025 | ||
| 1,1342 months agoMay 2025 | +0.6 % Change MoMMay – Jun |
Summary: The South Tampa real estate market had 1,141 homes for sale in Jun 2025, a 0.6 % increase compared to May 2025.
| Last Month | 2 months ago | Change MoM |
|---|---|---|
| 165Last MonthJun 2025 | ||
| 1702 months agoMay 2025 | -2.9 % Change MoMMay – Jun |
| Beds | May 2025 | Jun 2025 | Change MoM |
|---|---|---|---|
| 11 Bedroom | 54 | 58 | +7.4% |
| 22 Bedrooms | 199 | 220 | +10.6% |
| 33 Bedrooms | 404 | 396 | -2.0% |
| 44 Bedrooms | 283 | 282 | -0.4% |
| 55+ Bedrooms | 194 | 185 | -4.6% |
Summary: South Tampa housing inventory by bedroom type for June 2025, compared to the previous month. The inventory for 1 bedroom homes increased by +7.4%. The inventory for 2 bedroom homes increased by +10.6%. The inventory for 3 bedroom homes decreased by -2.0%. The inventory for 4 bedroom homes decreased by -0.4%. The inventory for 5 bedroom homes decreased by -4.6%.
How much do homes in South Tampa, FL cost?
Over Asking Price14 Homes
At Asking Price36 Homes
Under Asking Price115 Homes
If you're buying a home in South Tampa, you may be able to get a good deal. 69.7% of homes here sold below asking price last month.
Summary: A total of 165 homes were sold or pending in South Tampa in June 2025, down by 2.9% month-over-month. Of the 165 sold homes, 70% were sold under asking, 22% were sold at asking, and and 8% were sold over asking.
How long does it take to sell a home in South Tampa, FL?
Under 30 Days90 Homes
30 – 90 Days47 Homes
Over 90 Days28 Homes
Many homes in South Tampa are selling fast, if you're buying plan to act quickly.
Summary: During June 2025, 165 homes were sold in South Tampa; 55% of homes were sold within 30 days, 28% of homes were sold within 30 to 90 days, and 17% of homes were sold over 90 days.
| This Year | 1 year ago | Change YoY |
|---|---|---|
| 53 DaysThis YearJun 2025 | ||
| 36 Days1 year agoJun 2024 | +46.0 % Change YoYJun 2024 – Jun 2025 |
Summary: Homes in South Tampa had an average listing age of 53 days in Jun 2025, up by 46.0% compared to the previous year.
Connect With An Agent
Local real estate agents are ready to help you find a home here
Sell My Home
Sell your home with an expert or get the job done on your own.
Get Approved
Get a customizable mortgage solution based on today's rates.
What homes are available in South Tampa, FL?
#TB8409649, Alarico Fernandez, Listing office: SOLEI INTERNATIONAL REALTY LLC
#TB8409728, Carrissa Henshaw, Listing office: 3 POINT REAL ESTATE SOLUTION
#TB8405069, Michael Beum, Listing office: RED SASH REALTY LLC
#TB8409819, Mary Beth Byrd, Listing office: SMITH & ASSOCIATES REAL ESTATE
#TB8410321, Brad Suddath, Listing office: REALTY ADVISORS LLC
#TB8408458, Sarah Weaver, Listing office: COMPASS FLORIDA LLC
#TB8410114, Brian Wedlake, Listing office: GUARDIAN REAL ESTATE SERVICES
#O6329346, Thomas Nickley, Jr, Listing office: KELLER WILLIAMS REALTY AT THE PARKS
#TB8405857, Chris Campana, Listing office: COASTAL PROPERTIES GROUP INTER
#TB8410030, Sue-Tanya Crosbourne, Listing office: LPT REALTY, LLC
#TB8409984, Christopher Rogers, Listing office: LUCY LOMBARDI & ASSOCIATES
#TB8409940, Adam Kutchmire, Listing office: CENTURY 21 LIST WITH BEGGINS
Based on information from Stellar MLS, Miami MLS, Space Coast MLS, Hernando County Information Services MLS, and Daytona Beach MLS for the period 07/01/2023 - 07/01/2025
 Listings courtesy of Stellar MLS as distributed by MLS GRID.
 Copyright 2025 My Florida Regional Multiple Listing Service DBA Stellar MLS. The real estate listing data marked with this icon comes from the IDX program of the Stellar MLS system. All information provided is deemed reliable but is not guaranteed and should be independently verified. Listings displayed on this website may be subject to prior sale or removal from sale; availability of any listing should always be independently verified. Listing information is provided exclusively for consumers’ personal, non-commercial use, solely to identify potential properties for potential purchase; all other use is strictly prohibited and may violate relevant federal and state law. Properties displayed may be listed or sold by various participants in the MLS.
 © 2025 Miami Association of REALTORS®. All rights reserved. The data relating to real estate on this web site comes in part from the Internet Data Exchange program of the MLS of the Miami Association of REALTORS®. All information is deemed reliable but not guaranteed by the MLS and should be independently verified. The MLS, this broker and their affiliates provide all content therein “AS IS” and without any warranty, express or implied. The information included in this listing is provided exclusively for consumers’ personal, non-commercial use and may not be used for any purpose other than to identify prospective properties consumers may be interested in purchasing. This property is offered without respect to any protected classes in accordance with the law.
 Copyright © 2025 Multiple Listing Service of South Brevard, Inc. and Space Coast Association of REALTORS, Inc. All rights reserved. The data relating to real estate for sale on this web site comes in part from the Broker Reciprocity™ Program of Space Coast Multiple Listing Service. IDX information is provided exclusively for consumers’ personal, non-commercial use, that it may not be used for any purpose other than to identify prospective properties consumers may be interested in purchasing. Information Deemed Reliable But Not Guaranteed. Real estate listings held by brokerage firms other this broker are marked with the Broker Reciprocity™ logo or the Broker Reciprocity™ thumbnail logo (a little black house) and detailed information about them includes the name of the listing brokers. Some properties which appear for sale on this web site may subsequently have sold and may no longer be available.
 The information contained herein has been provided by by Hernando County Association of REALTORS®. This information is from sources deemed reliable but not guaranteed. The information is for consumers' personal, non-commerical use and may not be used for any purpose other than identifying properties which consumers may be interested in purchasing. The information contained in this web site is believed to be reliable and while every effort is made to assure that the information is as accurate as possible, the owner of this site disclaims any implied warranty or representation about it's accuracy, completeness or appropriateness for any particular purpose. This includes but is not limited to information provided by any third party which is accessed through this site via a hyperlink. Those persons who access this information assume full responsibility for the use of said information and understand and agree that the owner of this site named above not responsible or liable for any claim, loss or damage arising from the use of any information contained in this site. Any reference to specific products, companies or services does not necessarily constitute or imply recommendation or endorsement by the owner of this site.
  IDX information is provided exclusively for consumers’ personal, non-commercial use, that it may not be used for any purpose other than to identify prospective properties consumers may be interested in purchasing, and that the data is deemed reliable but is not guaranteed accurate by the MLS.