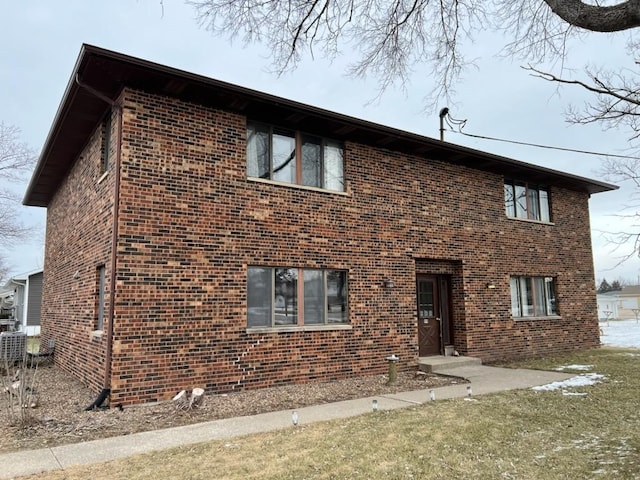
1 day on RocketTour
#2506214, Bob Kula, Listing office: IOWA REALTY


How much do homes in Fremont Township, IA cost?
Is Fremont Township, IA a buyer’s or seller’s market?
Seller'sMarket
Buyer'sMarket
Fremont Township is a Seller's Market
Difference Since May 2025
Last month, Fremont Township has remained a Seller's Market.
Fremont Township is a Sellers Housing Market, which means prices tend to be higher and homes sell faster.
Based on all homes sold in June 2025
Homes in Fremont Township have sold for 23.3% less than they did a month ago.
Summary: The median home sold price in Fremont Township was $287,500 in June 2025, down 23.3% from last month, and the median price per square foot was $154.
| City | May 2025 | Jun 2025 | Change MoM |
|---|---|---|---|
| Canton Township | $420K | $465K | +10.7% |
| Atkins | $375K | $287.5K | -23.3% |
| Fremont Township | $375K | $287.5K | -23.3% |
| Beds | May 2025 | Jun 2025 | Change MoM |
|---|---|---|---|
| 11 Bedroom | - | - | N/A |
| 22 Bedrooms | - | - | N/A |
| 33 Bedrooms | - | $287.5K | N/A |
| 44 Bedrooms | $375K | - | N/A |
| 55+ Bedrooms | - | - | N/A |
Summary: Fremont Township housing price by bedroom type for June 2025, compared to the previous month. The home price for 1 bedroom homes did not change. The home price for 2 bedroom homes did not change. The home price for 3 bedroom homes did not change. The home price for 4 bedroom homes did not change. The home price for 5 bedroom homes did not change.
Market comparison tool
Data and numbers shown are subject to change and may vary based on different timeframes.
Fremont Township, IA
How many homes are available in Fremont Township, IA?
| Last Month | 2 months ago | Change MoM |
|---|---|---|
| 8Last MonthJun 2025 | ||
| 52 months agoMay 2025 | +60.0 % Change MoMMay – Jun |
Summary: The Fremont Township real estate market had 8 homes for sale in Jun 2025, a 60.0 % increase compared to May 2025.
| Last Month | 2 months ago | Change MoM |
|---|---|---|
| 2Last MonthJun 2025 | ||
| 12 months agoMay 2025 | +100.0 % Change MoMMay – Jun |
| Beds | May 2025 | Jun 2025 | Change MoM |
|---|---|---|---|
| 11 Bedroom | 0 | 0 | 0.0% |
| 22 Bedrooms | 0 | 2 | +100.0% |
| 33 Bedrooms | 3 | 3 | 0.0% |
| 44 Bedrooms | 2 | 1 | -50.0% |
| 55+ Bedrooms | 0 | 2 | +100.0% |
Summary: Fremont Township housing inventory by bedroom type for June 2025, compared to the previous month. The inventory for 1 bedroom homes remained the same. The inventory for 2 bedroom homes increased by +100.0%. The inventory for 3 bedroom homes remained the same. The inventory for 4 bedroom homes decreased by -50.0%. The inventory for 5 bedroom homes increased by +100.0%.
How much do homes in Fremont Township, IA cost?
Over Asking Price1 Home
At Asking Price0 Home
Under Asking Price1 Home
If you're buying a home in Fremont Township, you may be able to get a good deal. 50% of homes here sold below asking price last month.
Summary: A total of 2 homes were sold or pending in Fremont Township in June 2025, up by 100.0% month-over-month. Of the 2 sold homes, 50% were sold under asking, 0% were sold at asking, and and 50% were sold over asking.
How long does it take to sell a home in Fremont Township, IA?
Under 30 Days2 Homes
30 – 90 Days0 Home
Over 90 Days0 Home
Many homes in Fremont Township are selling fast, if you're buying plan to act quickly.
Summary: During June 2025, 2 homes were sold in Fremont Township; 100% of homes were sold within 30 days, 0% of homes were sold within 30 to 90 days, and 0% of homes were sold over 90 days.
| Last Month | 1 month ago | Change MoM |
|---|---|---|
| 13 DaysLast MonthJun 2025 | ||
| 31 Days1 month agoMay 2025 | -58.1 % Change MoMMay – Jun |
Summary: Homes in Fremont Township had an average listing age of 13 days in Jun 2025, down by 58.1% compared to the previous month.
Connect With An Agent
Local real estate agents are ready to help you find a home here
Sell My Home
Sell your home with an expert or get the job done on your own.
Get Approved
Get a customizable mortgage solution based on today's rates.
What homes are available in Fremont Township, IA?
#2506214, Bob Kula, Listing office: IOWA REALTY
#2506102, Tami Timm, Listing office: Realty87
#2505850, Tami Timm, Listing office: Realty87
#2504442, Lori Frett, Listing office: SKOGMAN REALTY
#2503839, Kristena Kramer, Listing office: RUHL & RUHL REALTORS®
#2504231, Kristena Kramer, Listing office: RUHL & RUHL REALTORS®
#2504125, Connie Barnes, Listing office: Barnes Real Estate
#2503696, Tami Timm, Listing office: COLDWELL BANKER HEDGES
#2407380, Dan Kaestner, Listing office: IOWA REALTY
Nearby markets aren't available for Fremont Township, IA
Based on information from Cedar Rapids MLS, for the period 05/01/2025 - 07/01/2025
 Provided Courtesy Of Cedar Rapids Area Association of REALTORS®. IDX information is provided exclusively for consumers' personal, non-commercial use and may not be used for any purpose other than to identify prospective properties consumers may be interested in purchasing. Information Is Believed To Be Accurate But Not Guaranteed.