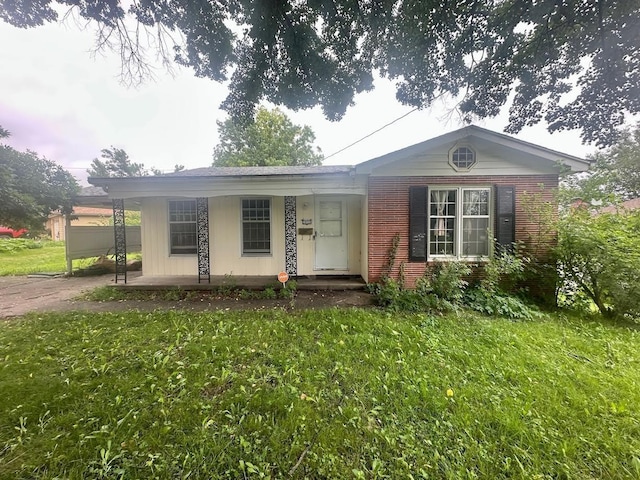
11 hours on Rocket
#722948, JULIA WATERMILLER, Listing office: Iowa Realty Beaverdale


How much do homes in Lower Beaver, IA cost?
Is Lower Beaver, IA a buyer’s or seller’s market?
Seller'sMarket
Buyer'sMarket
Lower Beaver is a Seller's Market
Difference Since June 2024
Since last year, Lower Beaver has remained a Seller's Market.
Lower Beaver is a Sellers Housing Market, which means prices tend to be higher and homes sell faster.
Based on all homes sold in the last 12 months
Homes in Lower Beaver have sold for 1.9% less than they did a year ago.
Summary: The median home sold price in Lower Beaver was $260,000 in June 2025, down 1.9% from last year, and the median price per square foot was $213.
| City | Jun 2024 | Jun 2025 | Change YoY |
|---|---|---|---|
| Oak Park | $175K | $182.6K | +4.4% |
| Lower Beaver | $265K | $260K | -1.9% |
| Beds | Jun 2024 | Jun 2025 | Change YoY |
|---|---|---|---|
| 11 Bedroom | $118.4K | $155K | +30.9% |
| 22 Bedrooms | $169K | $217.5K | +28.7% |
| 33 Bedrooms | $261.5K | $257K | -1.7% |
| 44 Bedrooms | $304K | $276.5K | -9.0% |
| 55+ Bedrooms | $285K | $300K | +5.3% |
Summary: Lower Beaver housing price by bedroom type for June 2025, compared to the previous year. The home price for 1 bedroom homes increased by +30.9%. The home price for 2 bedroom homes increased by +28.7%. The home price for 3 bedroom homes decreased by -1.7%. The home price for 4 bedroom homes decreased by -9.0%. The home price for 5 bedroom homes increased by +5.3%.
Market comparison tool
Data and numbers shown are subject to change and may vary based on different timeframes.
Lower Beaver, IA
How many homes are available in Lower Beaver, IA?
| Last Month | 2 months ago | Change MoM |
|---|---|---|
| 42Last MonthJun 2025 | ||
| 462 months agoMay 2025 | -8.7 % Change MoMMay – Jun |
Summary: The Lower Beaver real estate market had 42 homes for sale in Jun 2025, a 8.7 % decrease compared to May 2025.
| Last Month | 2 months ago | Change MoM |
|---|---|---|
| 10Last MonthJun 2025 | ||
| 142 months agoMay 2025 | -28.6 % Change MoMMay – Jun |
| Beds | May 2025 | Jun 2025 | Change MoM |
|---|---|---|---|
| 11 Bedroom | 0 | 0 | 0.0% |
| 22 Bedrooms | 5 | 4 | -20.0% |
| 33 Bedrooms | 30 | 31 | +3.3% |
| 44 Bedrooms | 8 | 4 | -50.0% |
| 55+ Bedrooms | 3 | 3 | 0.0% |
Summary: Lower Beaver housing inventory by bedroom type for June 2025, compared to the previous month. The inventory for 1 bedroom homes remained the same. The inventory for 2 bedroom homes decreased by -20.0%. The inventory for 3 bedroom homes increased by +3.3%. The inventory for 4 bedroom homes decreased by -50.0%. The inventory for 5 bedroom homes remained the same.
How much do homes in Lower Beaver, IA cost?
Over Asking Price1 Home
At Asking Price2 Homes
Under Asking Price7 Homes
If you're buying a home in Lower Beaver, you may be able to get a good deal. 70% of homes here sold below asking price last month.
Summary: A total of 10 homes were sold or pending in Lower Beaver in June 2025, down by 28.6% month-over-month. Of the 10 sold homes, 70% were sold under asking, 20% were sold at asking, and and 10% were sold over asking.
How long does it take to sell a home in Lower Beaver, IA?
Under 30 Days7 Homes
30 – 90 Days1 Home
Over 90 Days2 Homes
Many homes in Lower Beaver are selling fast, if you're buying plan to act quickly.
Summary: During June 2025, 10 homes were sold in Lower Beaver; 70% of homes were sold within 30 days, 10% of homes were sold within 30 to 90 days, and 20% of homes were sold over 90 days.
| This Year | 1 year ago | Change YoY |
|---|---|---|
| 46 DaysThis YearJun 2025 | ||
| 26 Days1 year agoJun 2024 | +73.8 % Change YoYJun 2024 – Jun 2025 |
Summary: Homes in Lower Beaver had an average listing age of 46 days in Jun 2025, up by 73.8% compared to the previous year.
Connect With An Agent
Local real estate agents are ready to help you find a home here
Sell My Home
Sell your home with an expert or get the job done on your own.
Get Approved
Get a customizable mortgage solution based on today's rates.
What homes are available in Lower Beaver, IA?
#722948, JULIA WATERMILLER, Listing office: Iowa Realty Beaverdale
#722762, Seth Walker, Listing office: RE/MAX Concepts
#722656, Bradley Johnson, Listing office: Keller Williams Legacy Group
#722174, Liz Keller, Listing office: CHASE Collective
#722193, Erika Hansen, Listing office: RE/MAX Real Estate Center
#721917, Dallas Boerm, Listing office: EXIT Realty & Associates
#721785, Julia Mena, Listing office: RE/MAX Concepts
#721242, Ted Weaver, Listing office: RE/MAX Concepts
#720616, Lisa Vance, Listing office: LPT Realty, LLC
#720487, Pennie Carroll, Listing office: Pennie Carroll & Associates
#720266, Lynette Williamson, Listing office: Century 21 Signature
#719757, Beth Cochran, Listing office: Agency Iowa
Nearby markets aren't available for Lower Beaver, IA
Based on information from Des Moines MLS, for the period 07/01/2023 - 07/01/2025