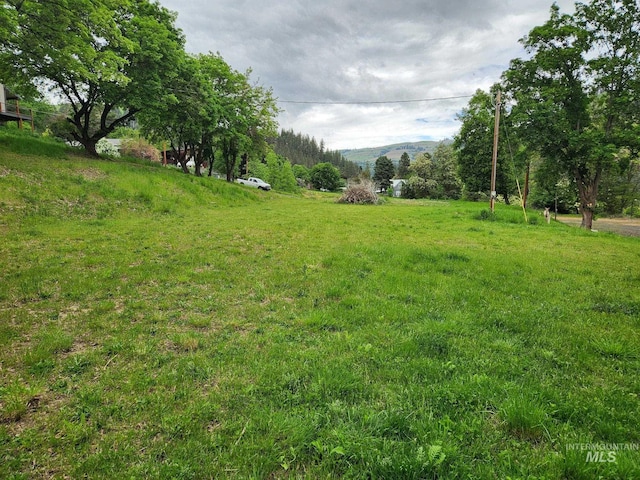
2 days on Rocket

#98955489, Michael Osorio, Listing office: Coldwell Banker Tomlinson Associates


How much do homes in Nez Perce, ID cost?
Based on all homes listed in the last 12 months
The list price of homes in Nez Perce has increased by 127.1% since last year.
Summary: The median home list price in Nez Perce was $647,250 in June 2025, up 127.1% from the previous year, and the median price per square foot was $308.
| Beds | Jun 2024 | Jun 2025 | Change YoY |
|---|---|---|---|
| 11 Bedroom | - | $995K | N/A |
| 22 Bedrooms | $275K | $399.5K | +45.3% |
| 33 Bedrooms | $462K | $599.5K | +29.8% |
| 44 Bedrooms | - | $825K | N/A |
| 55+ Bedrooms | - | $759K | N/A |
Summary: Nez Perce housing price by bedroom type for June 2025, compared to the previous year. The home price for 1 bedroom homes did not change. The home price for 2 bedroom homes increased by +45.3%. The home price for 3 bedroom homes increased by +29.8%. The home price for 4 bedroom homes did not change. The home price for 5 bedroom homes did not change.
Market comparison tool
Data and numbers shown are subject to change and may vary based on different timeframes.
Nez Perce, ID
How many homes are available in Nez Perce, ID?
| Last Month | 2 months ago | Change MoM |
|---|---|---|
| 14Last MonthJun 2025 | ||
| 132 months agoMay 2025 | +7.7 % Change MoMMay – Jun |
Summary: The Nez Perce real estate market had 14 homes for sale in Jun 2025, a 7.7 % increase compared to May 2025.
| Beds | May 2025 | Jun 2025 | Change MoM |
|---|---|---|---|
| 11 Bedroom | 3 | 3 | 0.0% |
| 22 Bedrooms | 1 | 1 | 0.0% |
| 33 Bedrooms | 7 | 8 | +14.3% |
| 44 Bedrooms | 1 | 1 | 0.0% |
| 55+ Bedrooms | 1 | 1 | 0.0% |
Summary: Nez Perce housing inventory by bedroom type for June 2025, compared to the previous month. The inventory for 1 bedroom homes remained the same. The inventory for 2 bedroom homes remained the same. The inventory for 3 bedroom homes increased by +14.3%. The inventory for 4 bedroom homes remained the same. The inventory for 5 bedroom homes remained the same.
How long does it take to sell a home in Nez Perce, ID?
| This Year | 1 year ago | Change YoY |
|---|---|---|
| 137 DaysThis YearJun 2025 | ||
| 158 Days1 year agoJun 2024 | -12.7 % Change YoYJun 2024 – Jun 2025 |
Summary: Homes in Nez Perce had an average listing age of 137 days in Jun 2025, down by 12.7% compared to the previous year.
Connect With An Agent
Local real estate agents are ready to help you find a home here
Sell My Home
Sell your home with an expert or get the job done on your own.
Get Approved
Get a customizable mortgage solution based on today's rates.
What homes are available in Nez Perce, ID?
#98955489, Michael Osorio, Listing office: Coldwell Banker Tomlinson Associates
#98954503, Loris Profitt, Listing office: Professional Realty Services Idaho
#98949023, Marcia Eades, Listing office: Idaho Country Properties
#98948907, Levi Gibson, Listing office: Coldwell Banker Tomlinson Associates
#98948624, Betty Cloninger, Listing office: Idaho Land & Home
#98946919, Connor Ward, Listing office: Kelly Right Real Estate-Idaho
#98946171, Keith Nichols, Listing office: The Real Estaters
#98946020, Colton Dudley, Listing office: Kelly Right Real Estate-Idaho
#98945936, Katy Mason, Listing office: Silvercreek Realty Group
#98944734, Michael Mccooey, Listing office: Clearwater Properties of Idaho
#98944058, Robert Pruitt, Listing office: Clearwater Properties of Idaho
#98943909, Katy Mason, Listing office: Silvercreek Realty Group
Based on information from Intermountain MLS, for the period 07/01/2023 - 07/01/2025
 Listings with this icon are © 2025 of InterMountain MLS. All Rights Reserved. IDX information is provided exclusively for consumers' personal, non-commercial use, it may not be used for any purpose other than to identify prospective properties consumers may be interested in purchasing. IMLS does not assume any liability for missing or inaccurate data. Information provided by IMLS is deemed reliable but not guaranteed.