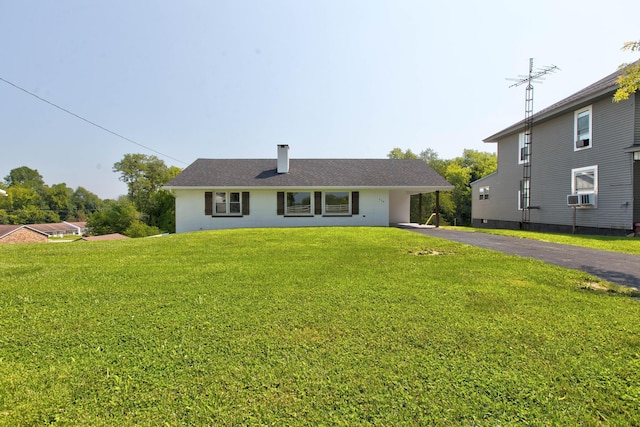
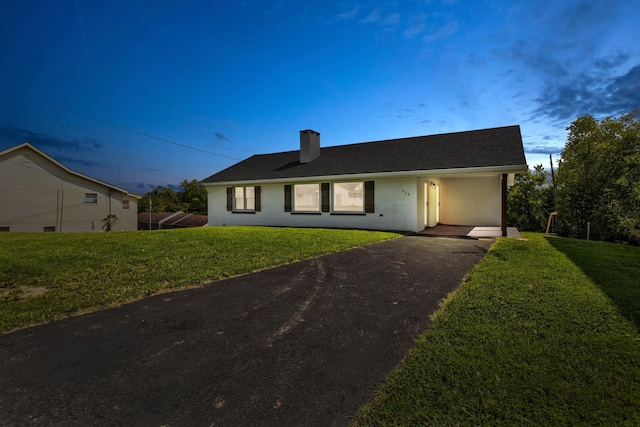
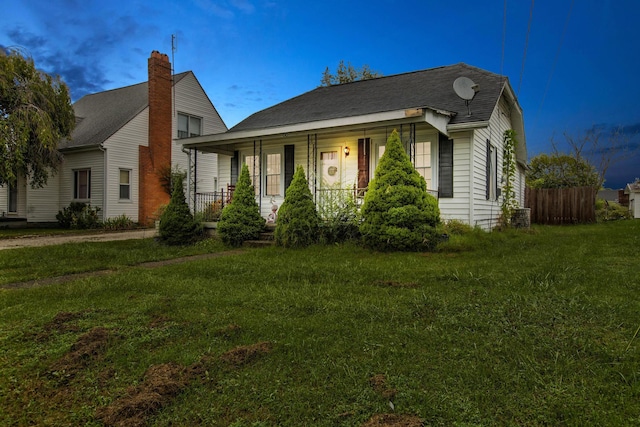
New - 4 days on Rocket
$1,781 Closing Credit¹

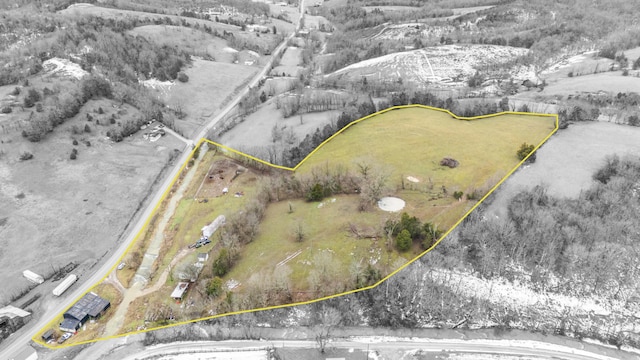
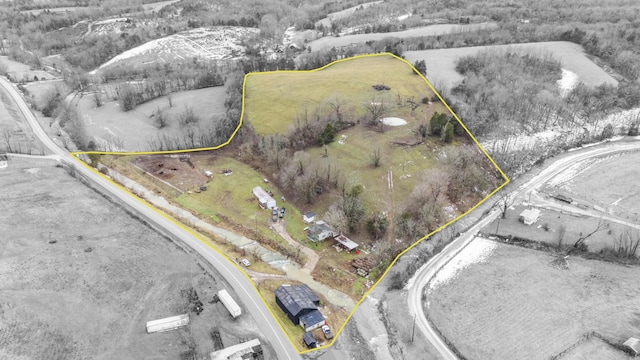
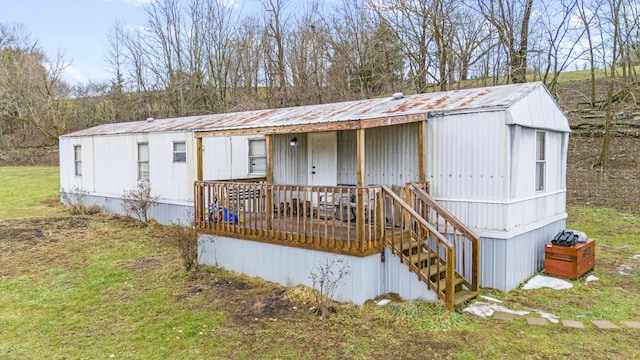
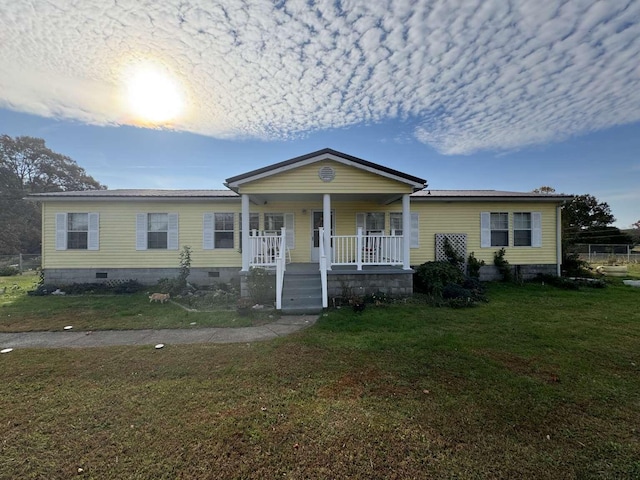
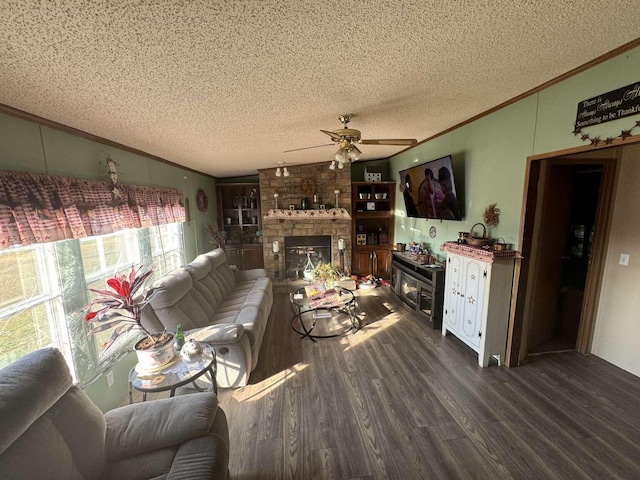
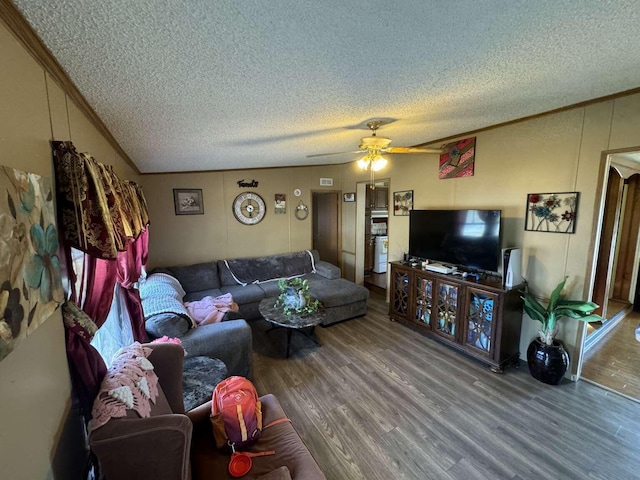
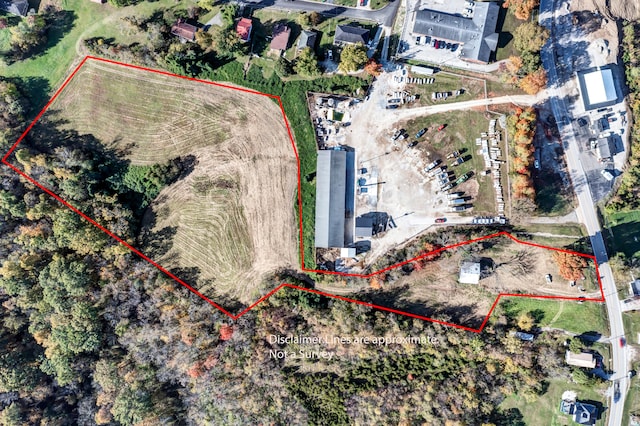
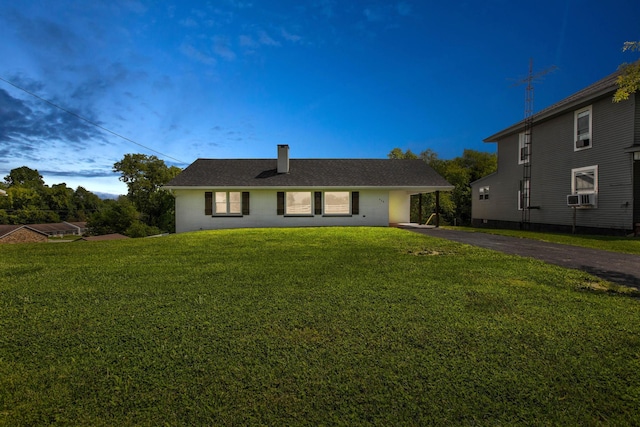
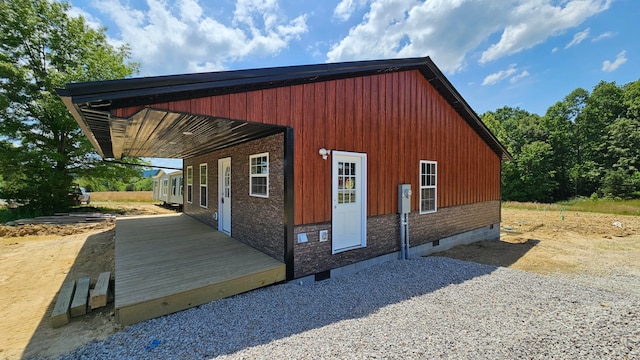
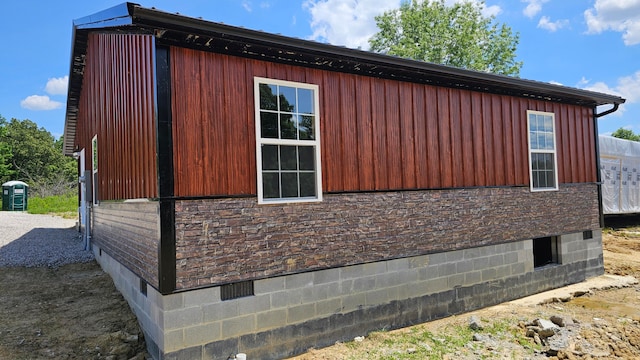
#25001799, Listing Office: Dream Maker Realty, LLC


How much do homes in Owingsville, KY cost?
Is Owingsville, KY a buyer’s or seller’s market?
Seller'sMarket
Buyer'sMarket
Owingsville is a Neutral Market
Difference Since January 2024
At the same time last year, Owingsville was a Seller's Market.
Owingsville is a Neutral Housing Market, which means prices tend to be reasonable and homes stay on the market for a typical length of time.
Based on all homes sold in the last 12 months
Homes in Owingsville have sold for 7.5% more than they did a year ago.
Summary: The median home sold price in Owingsville was $171,000 in January 2025, up 7.5% from last year, and the median price per square foot was $0.
| Beds | Jan 2024 | Jan 2025 | Change YoY |
|---|---|---|---|
| 11 Bedroom | - | $84.3K | N/A |
| 22 Bedrooms | $125K | $160K | +28.0% |
| 33 Bedrooms | $155.5K | $184K | +18.3% |
| 44 Bedrooms | $206.7K | $171K | -17.3% |
| 55+ Bedrooms | $235K | $422.5K | +79.8% |
Summary: Owingsville housing price by bedroom type for January 2025, compared to the previous year. The home price for 1 bedroom homes did not change. The home price for 2 bedroom homes increased by +28.0%. The home price for 3 bedroom homes increased by +18.3%. The home price for 4 bedroom homes decreased by -17.3%. The home price for 5 bedroom homes increased by +79.8%.
How many homes are available in Owingsville, KY?
| Last Month | 2 months ago | Change MoM |
|---|---|---|
| 27Last MonthJan 2025 | ||
| 272 months agoDec 2024 | 0.0 % Change MoMDec – Jan |
Summary: The Owingsville real estate market had 27 homes for sale in Jan 2025, the same as Dec 2024
| Last Month | 2 months ago | Change MoM |
|---|---|---|
| 4Last MonthJan 2025 | ||
| 32 months agoDec 2024 | +33.3 % Change MoMDec – Jan |
| Beds | Dec 2024 | Jan 2025 | Change MoM |
|---|---|---|---|
| 11 Bedroom | 0 | 0 | 0.0% |
| 22 Bedrooms | 5 | 4 | -20.0% |
| 33 Bedrooms | 13 | 17 | +30.8% |
| 44 Bedrooms | 7 | 4 | -42.9% |
| 55+ Bedrooms | 2 | 2 | 0.0% |
Summary: Owingsville housing inventory by bedroom type for January 2025, compared to the previous month. The inventory for 1 bedroom homes remained the same. The inventory for 2 bedroom homes decreased by -20.0%. The inventory for 3 bedroom homes increased by +30.8%. The inventory for 4 bedroom homes decreased by -42.9%. The inventory for 5 bedroom homes remained the same.
How much do homes in Owingsville, KY cost?
Over Asking Price1 Home
At Asking Price1 Home
Under Asking Price2 Homes
If you're buying a home in Owingsville, you may be able to get a good deal. 50% of homes here sold below asking price last month.
Summary: A total of 4 homes were sold or pending in Owingsville in January 2025, up by 33.3% month-over-month. Of the 4 sold homes, 50% were sold under asking, 25% were sold at asking, and and 25% were sold over asking.
How long does it take to sell a home in Owingsville, KY?
Under 30 Days1 Home
30 – 90 Days2 Homes
Over 90 Days1 Home
Avg time on Rocket Homes in Owingsville has remained consistent over time.
Summary: During January 2025, 4 homes were sold in Owingsville; 25% of homes were sold within 30 days, 50% of homes were sold within 30 to 90 days, and 25% of homes were sold over 90 days.
| This Year | 1 year ago | Change YoY |
|---|---|---|
| 129 DaysThis YearJan 2025 | ||
| 26 Days1 year agoJan 2024 | +385.6 % Change YoYJan 2024 – Jan 2025 |
Summary: Homes in Owingsville had an average listing age of 129 days in Jan 2025, up by 385.6% compared to the previous year.
Connect With An Agent
Local real estate agents are ready to help you find a home here
Sell My Home
Sell your home with an expert or get the job done on your own.
Get Approved
Get a customizable mortgage solution based on today's rates.
What homes are available in Owingsville, KY?
#25001799, Listing Office: Dream Maker Realty, LLC
#25001211, Listing Office: DIYFlatFee.com


#25000621, Listing Office: CENTURY 21 Advantage Realty
#25000562, Listing Office: The Agency

#25000172, Listing Office: Dream Maker Realty, LLC
#25000141, Listing Office: EXP Realty, LLC
#24024183, Listing Office: Century 21 Advantage Realty - Georgetown
#24023902, Listing Office: The Agency
#24023729, Listing Office: Kentucky Residential Real Estate, LLC
#24023406, Listing Office: HomeLand Real Estate Inc
#24023121, Listing Office: Murphy Realty Group

#24023114, Listing Office: Murphy Realty Group
Nearby markets aren't available for Owingsville, KY
Based on information from Imagine MLS, for the period 02/01/2023 - 02/01/2025
 The data relating to real estate for sale on this web site comes in part from the Internet Data Exchange Program of the Lexington-Bluegrass Association of Realtors Multiple Listing Service. Real estate listings held by IDX Brokerage firms other than this broker, are marked with the IDX logo or the IDX thumbnail logo and detailed information about them includes the name of the listing IDX Brokers. Information deemed reliable but not guaranteed. All properties are subject to prior sale, change or withdrawal. Listing(s) information is provided exclusively for consumers' personal, non-commercial use and may not be used for any purpose other than to identify prospective properties consumers may be interested in purchasing. © 2025 LBAR Multiple Listing Service. All rights reserved.