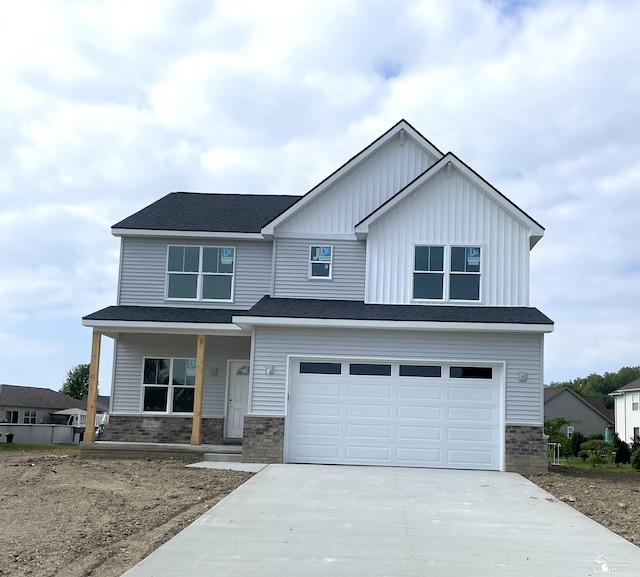
1 day on Rocket
#20251016967, Ronald S Vesche, Listing office: Coldwell Banker Professionals-Plymouth


How much do homes in Newport, MI cost?
Is Newport, MI a buyer’s or seller’s market?
Seller'sMarket
Buyer'sMarket
Newport is a Seller's Market
Difference Since June 2024
Since last year, Newport has remained a Seller's Market.
Newport is a Sellers Housing Market, which means prices tend to be higher and homes sell faster.
Based on all homes sold in the last 12 months
Homes in Newport have sold for 18.9% more than they did a year ago.
Summary: The median home sold price in Newport was $315,000 in June 2025, up 18.9% from last year, and the median price per square foot was $162.
| City | Jun 2024 | Jun 2025 | Change YoY |
|---|---|---|---|
| Newport | $265K | $315K | +18.9% |
| Frenchtown Township | $215K | $233.3K | +8.5% |
| Berlin Charter Township | $300K | $315.3K | +5.1% |
| Ash Township | $342.4K | $245K | -28.5% |
| Beds | Jun 2024 | Jun 2025 | Change YoY |
|---|---|---|---|
| 11 Bedroom | - | - | N/A |
| 22 Bedrooms | $158K | $157.4K | -0.3% |
| 33 Bedrooms | $248.5K | $299.9K | +20.7% |
| 44 Bedrooms | $340K | $349.9K | +2.9% |
| 55+ Bedrooms | $564.9K | - | N/A |
Summary: Newport housing price by bedroom type for June 2025, compared to the previous year. The home price for 1 bedroom homes did not change. The home price for 2 bedroom homes decreased by -0.3%. The home price for 3 bedroom homes increased by +20.7%. The home price for 4 bedroom homes increased by +2.9%. The home price for 5 bedroom homes did not change.
Market comparison tool
Data and numbers shown are subject to change and may vary based on different timeframes.
Newport, MI
How many homes are available in Newport, MI?
| Last Month | 2 months ago | Change MoM |
|---|---|---|
| 49Last MonthJun 2025 | ||
| 392 months agoMay 2025 | +25.6 % Change MoMMay – Jun |
Summary: The Newport real estate market had 49 homes for sale in Jun 2025, a 25.6 % increase compared to May 2025.
| Last Month | 2 months ago | Change MoM |
|---|---|---|
| 10Last MonthJun 2025 | ||
| 72 months agoMay 2025 | +42.9 % Change MoMMay – Jun |
| Beds | May 2025 | Jun 2025 | Change MoM |
|---|---|---|---|
| 11 Bedroom | 0 | 0 | 0.0% |
| 22 Bedrooms | 1 | 5 | +400.0% |
| 33 Bedrooms | 25 | 26 | +4.0% |
| 44 Bedrooms | 10 | 14 | +40.0% |
| 55+ Bedrooms | 3 | 4 | +33.3% |
Summary: Newport housing inventory by bedroom type for June 2025, compared to the previous month. The inventory for 1 bedroom homes remained the same. The inventory for 2 bedroom homes increased by +400.0%. The inventory for 3 bedroom homes increased by +4.0%. The inventory for 4 bedroom homes increased by +40.0%. The inventory for 5 bedroom homes increased by +33.3%.
How much do homes in Newport, MI cost?
Over Asking Price5 Homes
At Asking Price4 Homes
Under Asking Price1 Home
If you're buying a home in Newport, you could pay more than the asking price. 50% of homes here sold above asking price last month.
Summary: A total of 10 homes were sold or pending in Newport in June 2025, up by 42.9% month-over-month. Of the 10 sold homes, 10% were sold under asking, 40% were sold at asking, and and 50% were sold over asking.
How long does it take to sell a home in Newport, MI?
Under 30 Days7 Homes
30 – 90 Days1 Home
Over 90 Days2 Homes
Many homes in Newport are selling fast, if you're buying plan to act quickly.
Summary: During June 2025, 10 homes were sold in Newport; 70% of homes were sold within 30 days, 10% of homes were sold within 30 to 90 days, and 20% of homes were sold over 90 days.
| This Year | 1 year ago | Change YoY |
|---|---|---|
| 46 DaysThis YearJun 2025 | ||
| 23 Days1 year agoJun 2024 | +101.3 % Change YoYJun 2024 – Jun 2025 |
Summary: Homes in Newport had an average listing age of 46 days in Jun 2025, up by 101.3% compared to the previous year.
Connect With An Agent
Local real estate agents are ready to help you find a home here
Sell My Home
Sell your home with an expert or get the job done on your own.
Get Approved
Get a customizable mortgage solution based on today's rates.
What homes are available in Newport, MI?
#20251016967, Ronald S Vesche, Listing office: Coldwell Banker Professionals-Plymouth
#57050181194, Lori Ratz, Listing office: Wiens And Roth Real Estate - Lambertville
#20251015798, Lisa A Sobell, Listing office: Real Estate One-Southgate
#20251014269, Chad Liptow, Listing office: Premiere Realty Group LLC
#20251014925, Michael Procissi, Listing office: Power House Group Realty
#57050180687, Marcia Siddall, Listing office: Key Realty One LLC in Monroe
#20251014016, George Stathakis, Listing office: Coldwell Banker Professionals-Plymouth
#57050180406, Victoria Camaj, Listing office: Providence Properties, Realty & Management
#20251013051, Alison Reedy, Listing office: Four Seasons Realty Dan Berry Group
#57050180107, Justin Kurtz, Listing office: eXp Realty LLC in Monroe
#20251010473, Bonita G Beales, Listing office: National Realty Centers, Inc
#57050178504, Marcia Williams, Listing office: Monroe Real Estate - Monroe
Based on information from RealComp II Ltd., and Michigan Regional Information Center LLC for the period 07/01/2023 - 07/01/2025
 Disclaimer: The data relating to real estate on this web site comes in part from the IDX of Realcomp II Ltd. The accuracy of all information, regardless of source, is not guaranteed or warranted. All information should be independently verified.
  Disclaimer: Information deemed reliable, but not guaranteed. All properties are subject to prior sale, change or withdrawal. Neither listing broker(s) nor this broker shall be responsible for any typographical errors, misinformation, misprints and shall be held totally harmless. The data relating to real estate for sale on this website comes in part from the Broker Reciprocity Program of MichRIC, LLC. Real estate listings held by brokerage firms other than this broker are marked with the BR logo and detailed information includes the name of the listing broker. Copyright 2025 Grand Rapids Association of REALTORS® / Copyright © MichRIC, LLC. / MLS Exchange Inc. All rights reserved.