2 days on Rocket
$10,000 Closing Credit¹
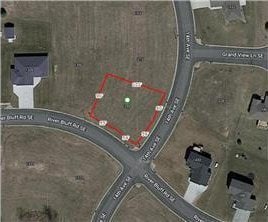
#6730177, Listing Office: Edina Realty, Inc.


How much do homes in Mazeppa Township, MN cost?
Is Mazeppa Township, MN a buyer’s or seller’s market?
Seller'sMarket
Buyer'sMarket
Mazeppa Township is a Seller's Market
Difference Since May 2024
Since last year, Mazeppa Township has remained a Seller's Market.
Mazeppa Township is a Sellers Housing Market, which means prices tend to be higher and homes sell faster.
Based on all homes sold in the last 12 months
Homes in Mazeppa Township have sold for 15.4% less than they did a year ago.
Summary: The median home sold price in Mazeppa Township was $325,000 in May 2025, down 15.4% from last year, and the median price per square foot was $172.
| City | May 2024 | May 2025 | Change YoY |
|---|---|---|---|
| Mazeppa | $384K | $325K | -15.4% |
| Mazeppa Township | $384K | $325K | -15.4% |
| Beds | May 2024 | May 2025 | Change YoY |
|---|---|---|---|
| 11 Bedroom | - | $365K | N/A |
| 22 Bedrooms | $385K | $270K | -29.9% |
| 33 Bedrooms | $295K | $325K | +10.2% |
| 44 Bedrooms | $335K | $489.9K | +46.2% |
| 55+ Bedrooms | - | $205K | N/A |
Summary: Mazeppa Township housing price by bedroom type for May 2025, compared to the previous year. The home price for 1 bedroom homes did not change. The home price for 2 bedroom homes decreased by -29.9%. The home price for 3 bedroom homes increased by +10.2%. The home price for 4 bedroom homes increased by +46.2%. The home price for 5 bedroom homes did not change.
Market comparison tool
Data and numbers shown are subject to change and may vary based on different timeframes.
Mazeppa Township, MN
How many homes are available in Mazeppa Township, MN?
| Last Month | 2 months ago | Change MoM |
|---|---|---|
| 10Last MonthMay 2025 | ||
| 52 months agoApr 2025 | +100.0 % Change MoMApr – May |
Summary: The Mazeppa Township real estate market had 10 homes for sale in May 2025, a 100.0 % increase compared to Apr 2025.
| Last Month | 2 months ago | Change MoM |
|---|---|---|
| 2Last MonthMay 2025 | ||
| 02 months agoApr 2025 | +100.0 % Change MoMApr – May |
| Beds | Apr 2025 | May 2025 | Change MoM |
|---|---|---|---|
| 11 Bedroom | 1 | 1 | 0.0% |
| 22 Bedrooms | 0 | 3 | +100.0% |
| 33 Bedrooms | 2 | 3 | +50.0% |
| 44 Bedrooms | 2 | 3 | +50.0% |
| 55+ Bedrooms | 0 | 0 | 0.0% |
Summary: Mazeppa Township housing inventory by bedroom type for May 2025, compared to the previous month. The inventory for 1 bedroom homes remained the same. The inventory for 2 bedroom homes increased by +100.0%. The inventory for 3 bedroom homes increased by +50.0%. The inventory for 4 bedroom homes increased by +50.0%. The inventory for 5 bedroom homes remained the same.
How much do homes in Mazeppa Township, MN cost?
Over Asking Price1 Home
At Asking Price1 Home
Under Asking Price0 Home
If you're buying a home in Mazeppa Township, expect to pay close to the asking price. 50% of homes here sold near the asking price last month.
Summary: A total of 2 homes were sold or pending in Mazeppa Township in May 2025, up by 100.0% month-over-month. Of the 2 sold homes, 0% were sold under asking, 50% were sold at asking, and and 50% were sold over asking.
How long does it take to sell a home in Mazeppa Township, MN?
Under 30 Days1 Home
30 – 90 Days0 Home
Over 90 Days1 Home
Many homes in Mazeppa Township are selling fast, if you're buying plan to act quickly.
Summary: During May 2025, 2 homes were sold in Mazeppa Township; 50% of homes were sold within 30 days, 0% of homes were sold within 30 to 90 days, and 50% of homes were sold over 90 days.
| This Year | 1 year ago | Change YoY |
|---|---|---|
| 123 DaysThis YearMay 2025 | ||
| 193 Days1 year agoMay 2024 | -36.3 % Change YoYMay 2024 – May 2025 |
Summary: Homes in Mazeppa Township had an average listing age of 123 days in May 2025, down by 36.3% compared to the previous year.
Connect With An Agent
Local real estate agents are ready to help you find a home here
Sell My Home
Sell your home with an expert or get the job done on your own.
Get Approved
Get a customizable mortgage solution based on today's rates.
What homes are available in Mazeppa Township, MN?
#6730177, Listing Office: Edina Realty, Inc.
#6726165, Listing Office: RE/MAX Advantage Plus
#6724266, Listing Office: eXp Realty
#6721974, Listing Office: Re/Max Results
#6719570, Listing Office: Re/Max Results
#6680098, Listing Office: Re/Max Results
#6680103, Listing Office: Re/Max Results
#6680089, Listing Office: Re/Max Results
#6631085, Listing Office: Schurhammer Real Estate, LLC
#6631079, Listing Office: Schurhammer Real Estate, LLC
Nearby markets aren't available for Mazeppa Township, MN
Based on information from NorthStar of Minnesota / Regional Multiple Listing Service of Minnesota Inc., for the period 06/01/2023 - 06/01/2025

 Copyright © 2025 Regional Multiple Listing Service of Minnesota, Inc. All rights reserved.