28 minutes on Rocket
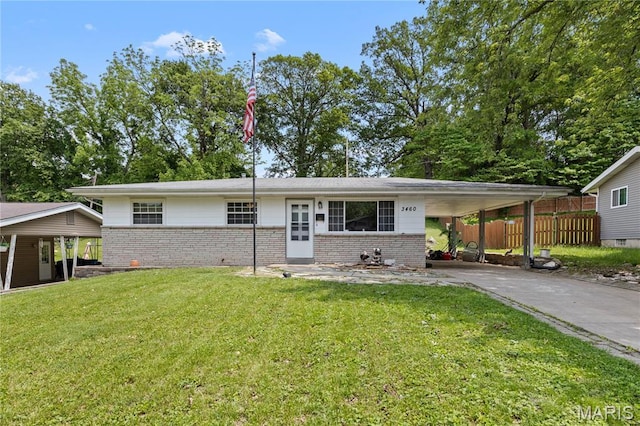
#25050350, Listing office: Platinum Arch Property, LLC


How much do homes in Saint John, MO cost?
Is Saint John, MO a buyer’s or seller’s market?
Seller'sMarket
Buyer'sMarket
Saint John is a Seller's Market
Difference Since June 2024
Since last year, Saint John has remained a Seller's Market.
Saint John is a Sellers Housing Market, which means prices tend to be higher and homes sell faster.
Based on all homes sold in the last 12 months
Homes in Saint John have sold for 16% more than they did a year ago.
Summary: The median home sold price in Saint John was $145,000 in June 2025, up 16% from last year, and the median price per square foot was $116.
| City | Jun 2024 | Jun 2025 | Change YoY |
|---|---|---|---|
| Woodson Terrace | $129K | $151K | +17.1% |
| Saint John | $125K | $145K | +16.0% |
| Breckenridge Hills | $112K | $115K | +2.7% |
| Charlack | $168K | $130K | -22.6% |
| Beds | Jun 2024 | Jun 2025 | Change YoY |
|---|---|---|---|
| 11 Bedroom | $70.4K | $125K | +77.4% |
| 22 Bedrooms | $126K | $125K | -0.8% |
| 33 Bedrooms | $132K | $150K | +13.6% |
| 44 Bedrooms | $131.7K | $197.5K | +49.9% |
| 55+ Bedrooms | - | - | N/A |
Summary: Saint John housing price by bedroom type for June 2025, compared to the previous year. The home price for 1 bedroom homes increased by +77.4%. The home price for 2 bedroom homes decreased by -0.8%. The home price for 3 bedroom homes increased by +13.6%. The home price for 4 bedroom homes increased by +49.9%. The home price for 5 bedroom homes did not change.
Market comparison tool
Data and numbers shown are subject to change and may vary based on different timeframes.
Saint John, MO
How many homes are available in Saint John, MO?
| Last Month | 2 months ago | Change MoM |
|---|---|---|
| 22Last MonthJun 2025 | ||
| 292 months agoMay 2025 | -24.1 % Change MoMMay – Jun |
Summary: The Saint John real estate market had 22 homes for sale in Jun 2025, a 24.1 % decrease compared to May 2025.
| Last Month | 2 months ago | Change MoM |
|---|---|---|
| 5Last MonthJun 2025 | ||
| 142 months agoMay 2025 | -64.3 % Change MoMMay – Jun |
| Beds | May 2025 | Jun 2025 | Change MoM |
|---|---|---|---|
| 11 Bedroom | 1 | 1 | 0.0% |
| 22 Bedrooms | 11 | 11 | 0.0% |
| 33 Bedrooms | 12 | 8 | -33.3% |
| 44 Bedrooms | 4 | 1 | -75.0% |
| 55+ Bedrooms | 1 | 1 | 0.0% |
Summary: Saint John housing inventory by bedroom type for June 2025, compared to the previous month. The inventory for 1 bedroom homes remained the same. The inventory for 2 bedroom homes remained the same. The inventory for 3 bedroom homes decreased by -33.3%. The inventory for 4 bedroom homes decreased by -75.0%. The inventory for 5 bedroom homes remained the same.
How much do homes in Saint John, MO cost?
Over Asking Price1 Home
At Asking Price0 Home
Under Asking Price4 Homes
If you're buying a home in Saint John, you may be able to get a good deal. 80% of homes here sold below asking price last month.
Summary: A total of 5 homes were sold or pending in Saint John in June 2025, down by 64.3% month-over-month. Of the 5 sold homes, 80% were sold under asking, 0% were sold at asking, and and 20% were sold over asking.
How long does it take to sell a home in Saint John, MO?
Under 30 Days2 Homes
30 – 90 Days3 Homes
Over 90 Days0 Home
Avg time on Rocket Homes in Saint John has remained consistent over time.
Summary: During June 2025, 5 homes were sold in Saint John; 40% of homes were sold within 30 days, 60% of homes were sold within 30 to 90 days, and 0% of homes were sold over 90 days.
| This Year | 1 year ago | Change YoY |
|---|---|---|
| 30 DaysThis YearJun 2025 | ||
| 10 Days1 year agoJun 2024 | +185.6 % Change YoYJun 2024 – Jun 2025 |
Summary: Homes in Saint John had an average listing age of 30 days in Jun 2025, up by 185.6% compared to the previous year.
Connect With An Agent
Local real estate agents are ready to help you find a home here
Sell My Home
Sell your home with an expert or get the job done on your own.
Get Approved
Get a customizable mortgage solution based on today's rates.
What homes are available in Saint John, MO?
#25050350, Listing office: Platinum Arch Property, LLC
#25048443, Listing office: R.P. Murphy, REALTORS LLC
#25048522, Listing office: Wood Brothers Realty
#25048321, Listing office: Worth Clark Realty
#25048943, Listing office: Coldwell Banker Realty - Gundaker
#25047240, Listing office: Worth Clark Realty
#25046686, Listing office: One West Associates, Inc.
#25046227, Listing office: STL Buy & Sell, LLC
#25043194, Listing office: Worth Clark Realty
#25043218, Listing office: Coldwell Banker Realty - Gundaker
#25041829, Listing office: Campbell House & Home
#25022981, Listing office: RE/MAX EDGE
Based on information from Mid America Regional Information System, for the period 07/01/2023 - 07/01/2025
 Listings courtesy of Mid America Regional Information System as distributed by MLS GRID.
 Based on information submitted to the MLS GRID. All data is obtained from various sources and may not have been verified by broker or MLS GRID. Supplied Open House Information is subject to change without notice. All information should be independently reviewed and verified for accuracy. Properties may or may not be listed by the office/agent presenting the information.