Coming soon
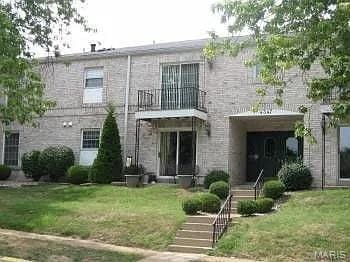
#25048452, Listing office: SCHNEIDER Real Estate


How much do homes in South County, MO cost?
Is South County, MO a buyer’s or seller’s market?
Seller'sMarket
Buyer'sMarket
South County is a Seller's Market
Difference Since June 2024
Since last year, South County has remained a Seller's Market.
South County is a Sellers Housing Market, which means prices tend to be higher and homes sell faster.
Based on all homes sold in the last 12 months
Homes in South County have sold for 5% more than they did a year ago.
Summary: The median home sold price in South County was $287,541 in June 2025, up 5% from last year, and the median price per square foot was $173.
| Beds | Jun 2024 | Jun 2025 | Change YoY |
|---|---|---|---|
| 11 Bedroom | $88.6K | $86.7K | -2.2% |
| 22 Bedrooms | $190K | $198.5K | +4.5% |
| 33 Bedrooms | $283K | $299K | +5.7% |
| 44 Bedrooms | $405K | $417.5K | +3.1% |
| 55+ Bedrooms | $527.5K | $588.2K | +11.5% |
Summary: South County housing price by bedroom type for June 2025, compared to the previous year. The home price for 1 bedroom homes decreased by -2.2%. The home price for 2 bedroom homes increased by +4.5%. The home price for 3 bedroom homes increased by +5.7%. The home price for 4 bedroom homes increased by +3.1%. The home price for 5 bedroom homes increased by +11.5%.
Market comparison tool
Data and numbers shown are subject to change and may vary based on different timeframes.
South County, MO
How many homes are available in South County, MO?
| Last Month | 2 months ago | Change MoM |
|---|---|---|
| 734Last MonthJun 2025 | ||
| 7072 months agoMay 2025 | +3.8 % Change MoMMay – Jun |
Summary: The South County real estate market had 734 homes for sale in Jun 2025, a 3.8 % increase compared to May 2025.
| Last Month | 2 months ago | Change MoM |
|---|---|---|
| 232Last MonthJun 2025 | ||
| 2342 months agoMay 2025 | -0.9 % Change MoMMay – Jun |
| Beds | May 2025 | Jun 2025 | Change MoM |
|---|---|---|---|
| 11 Bedroom | 15 | 18 | +20.0% |
| 22 Bedrooms | 201 | 220 | +9.5% |
| 33 Bedrooms | 311 | 312 | 0.3% |
| 44 Bedrooms | 157 | 161 | +2.5% |
| 55+ Bedrooms | 23 | 23 | 0.0% |
Summary: South County housing inventory by bedroom type for June 2025, compared to the previous month. The inventory for 1 bedroom homes increased by +20.0%. The inventory for 2 bedroom homes increased by +9.5%. The inventory for 3 bedroom homes decreased by 0.3%. The inventory for 4 bedroom homes increased by +2.5%. The inventory for 5 bedroom homes remained the same.
How much do homes in South County, MO cost?
Over Asking Price149 Homes
At Asking Price25 Homes
Under Asking Price58 Homes
If you're buying a home in South County, you could pay more than the asking price. 64.2% of homes here sold above asking price last month.
Summary: A total of 232 homes were sold or pending in South County in June 2025, down by 0.9% month-over-month. Of the 232 sold homes, 25% were sold under asking, 11% were sold at asking, and and 64% were sold over asking.
How long does it take to sell a home in South County, MO?
Under 30 Days162 Homes
30 – 90 Days64 Homes
Over 90 Days6 Homes
Many homes in South County are selling fast, if you're buying plan to act quickly.
Summary: During June 2025, 232 homes were sold in South County; 70% of homes were sold within 30 days, 28% of homes were sold within 30 to 90 days, and 3% of homes were sold over 90 days.
| This Year | 1 year ago | Change YoY |
|---|---|---|
| 24 DaysThis YearJun 2025 | ||
| 16 Days1 year agoJun 2024 | +49.5 % Change YoYJun 2024 – Jun 2025 |
Summary: Homes in South County had an average listing age of 24 days in Jun 2025, up by 49.5% compared to the previous year.
Connect With An Agent
Local real estate agents are ready to help you find a home here
Sell My Home
Sell your home with an expert or get the job done on your own.
Get Approved
Get a customizable mortgage solution based on today's rates.
What homes are available in South County, MO?
#25048452, Listing office: SCHNEIDER Real Estate
#25050760, Listing office: Compass Realty Group
#25050488, Listing office: Garcia Properties
#25048641, Listing office: EXP Realty, LLC
#25050724, Listing office: Coldwell Banker Realty - Gundaker
#25050064, Listing office: Realty Executives of St. Louis
#25050454, Listing office: Goodman Bautz
#25050625, Listing office: 1 Degree Realty
#25050136, Listing office: RedKey Realty Leaders
#25050561, Listing office: Keller Williams Realty St. Louis
#25043950, Listing office: Coldwell Banker Realty - Gundaker
#25049223, Listing office: Realty Executives of St. Louis
Based on information from Mid America Regional Information System, for the period 07/01/2023 - 07/01/2025
 Listings courtesy of Mid America Regional Information System as distributed by MLS GRID.
 Based on information submitted to the MLS GRID. All data is obtained from various sources and may not have been verified by broker or MLS GRID. Supplied Open House Information is subject to change without notice. All information should be independently reviewed and verified for accuracy. Properties may or may not be listed by the office/agent presenting the information.