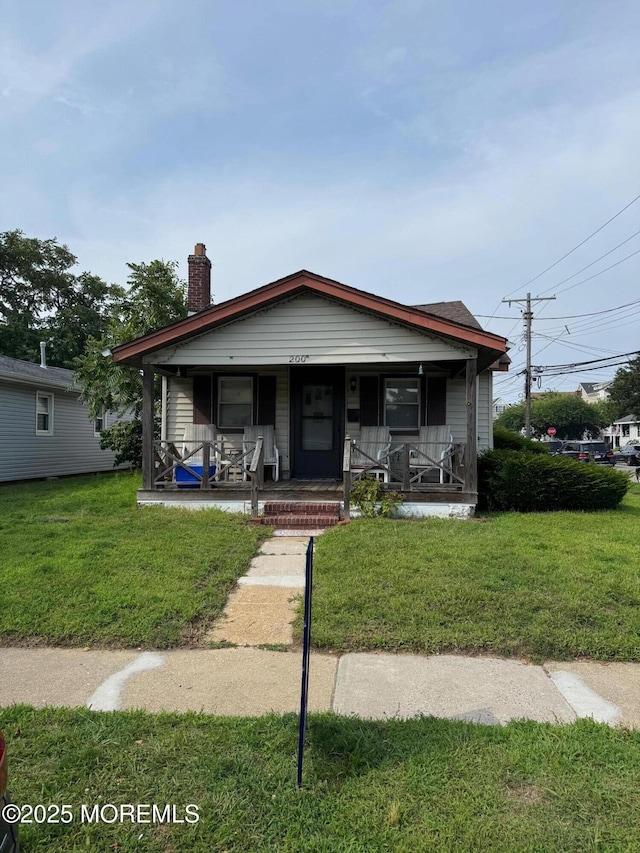
2 days on Rocket
#22522752, Nicholas Ferrone, Listing office: Real Broker, LLC- Point P


How much do homes in Belmar, NJ cost?
Is Belmar, NJ a buyer’s or seller’s market?
Seller'sMarket
Buyer'sMarket
Belmar is a Seller's Market
Difference Since July 2024
At the same time last year, Belmar was a Neutral Market.
Belmar is a Sellers Housing Market, which means prices tend to be higher and homes sell faster.
Based on all homes sold in the last 12 months
Homes in Belmar have sold for 8.8% less than they did a year ago.
Summary: The median home sold price in Belmar was $807,500 in July 2025, down 8.8% from last year, and the median price per square foot was $561.
| City | Jul 2024 | Jul 2025 | Change YoY |
|---|---|---|---|
| Neptune Township | $527.5K | $610K | +15.6% |
| Neptune | $485K | $550K | +13.4% |
| Lake Como | $674.9K | $668.7K | -0.9% |
| Belmar | $885.6K | $807.5K | -8.8% |
| Beds | Jul 2024 | Jul 2025 | Change YoY |
|---|---|---|---|
| 11 Bedroom | $432.4K | $417K | -3.6% |
| 22 Bedrooms | $654.4K | $523K | -20.1% |
| 33 Bedrooms | $905K | $771.7K | -14.7% |
| 44 Bedrooms | $1.3M | $1.1M | -19.1% |
| 55+ Bedrooms | $1.5M | $1.5M | +3.5% |
Summary: Belmar housing price by bedroom type for July 2025, compared to the previous year. The home price for 1 bedroom homes decreased by -3.6%. The home price for 2 bedroom homes decreased by -20.1%. The home price for 3 bedroom homes decreased by -14.7%. The home price for 4 bedroom homes decreased by -19.1%. The home price for 5 bedroom homes increased by +3.5%.
Market comparison tool
Data and numbers shown are subject to change and may vary based on different timeframes.
Belmar, NJ
How many homes are available in Belmar, NJ?
| Last Month | 2 months ago | Change MoM |
|---|---|---|
| 43Last MonthJul 2025 | ||
| 462 months agoJun 2025 | -6.5 % Change MoMJun – Jul |
Summary: The Belmar real estate market had 43 homes for sale in Jul 2025, a 6.5 % decrease compared to Jun 2025.
| Last Month | 2 months ago | Change MoM |
|---|---|---|
| 9Last MonthJul 2025 | ||
| 112 months agoJun 2025 | -18.2 % Change MoMJun – Jul |
| Beds | Jun 2025 | Jul 2025 | Change MoM |
|---|---|---|---|
| 11 Bedroom | 6 | 5 | -16.7% |
| 22 Bedrooms | 4 | 4 | 0.0% |
| 33 Bedrooms | 11 | 9 | -18.2% |
| 44 Bedrooms | 9 | 9 | 0.0% |
| 55+ Bedrooms | 16 | 16 | 0.0% |
Summary: Belmar housing inventory by bedroom type for July 2025, compared to the previous month. The inventory for 1 bedroom homes decreased by -16.7%. The inventory for 2 bedroom homes remained the same. The inventory for 3 bedroom homes decreased by -18.2%. The inventory for 4 bedroom homes remained the same. The inventory for 5 bedroom homes remained the same.
How much do homes in Belmar, NJ cost?
Over Asking Price6 Homes
At Asking Price0 Home
Under Asking Price3 Homes
If you're buying a home in Belmar, you could pay more than the asking price. 66.7% of homes here sold above asking price last month.
Summary: A total of 9 homes were sold or pending in Belmar in July 2025, down by 18.2% month-over-month. Of the 9 sold homes, 33% were sold under asking, 0% were sold at asking, and and 67% were sold over asking.
How long does it take to sell a home in Belmar, NJ?
Under 30 Days5 Homes
30 – 90 Days3 Homes
Over 90 Days1 Home
Many homes in Belmar are selling fast, if you're buying plan to act quickly.
Summary: During July 2025, 9 homes were sold in Belmar; 56% of homes were sold within 30 days, 33% of homes were sold within 30 to 90 days, and 11% of homes were sold over 90 days.
| This Year | 1 year ago | Change YoY |
|---|---|---|
| 35 DaysThis YearJul 2025 | ||
| 58 Days1 year agoJul 2024 | -38.5 % Change YoYJul 2024 – Jul 2025 |
Summary: Homes in Belmar had an average listing age of 35 days in Jul 2025, down by 38.5% compared to the previous year.
Connect With An Agent
Local real estate agents are ready to help you find a home here
Sell My Home
Sell your home with an expert or get the job done on your own.
Get Approved
Get a customizable mortgage solution based on today's rates.
What homes are available in Belmar, NJ?
#22522752, Nicholas Ferrone, Listing office: Real Broker, LLC- Point P
#22522820, Robert N Lange, Listing office: RE/MAX Gateway
#22522819, Victoria L Palmer, Listing office: C21/ Schlossbach Realty
#22522329, Richard B Kiernan, Listing office: Heritage House Sotheby's International Realty
#22521748, Edward James Szumski, Listing office: Berkshire Hathaway HomeServices Fox & Roach - Spring Lake
#22521527, Breana Shine, Listing office: EXP Realty
#22521650, Heather Garrett-Muly, Listing office: Keller Williams Realty Spring Lake
#22521604, Gayle Ciallella, Listing office: Callaway Henderson Sotheby's International Realty
#22521575, Theresa A Lee, Listing office: Coldwell Banker Realty
#22521352, Janet P Strzalkowski, Listing office: Crossroads Realty Inc-Lavallette
#22521138, Jacob L Smith, Listing office: Ward Wight Sotheby's International Realty
#22520878, Matthew Warncke, Listing office: Sackman Realty
Based on information from Monmouth Ocean Regional MLS, for the period 08/01/2023 - 08/01/2025
 The data relating to real estate for sale on this web site comes in part from the Internet Data exchange (“IDX”) program of the Monmouth/Ocean MLS Monmouth County Association Board of Realtors. IDX information is provided exclusively for consumers' personal, non-commercial use and may not be used for any purpose other than to identify prospective properties consumers may be interested in purchasing. Real estate listings held by other brokerage firms are indicated by detailed information about them such as the name of the listing firms. Information deemed reliable but not guaranteed. Copyright © 2025 Monmouth/Ocean MLS Monmouth County Association Board of Realtors. All Rights Reserved.