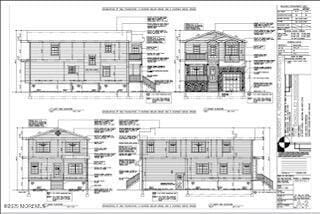
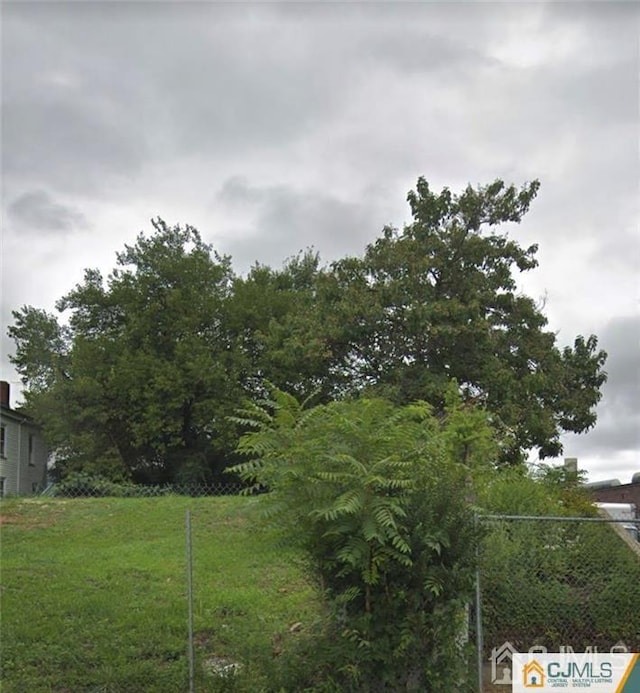
4 days on Rocket
#22520676, MaryBeth Tomaro, Listing office: Keller Williams Realty Central Monmouth


How much do homes in Port Monmouth, NJ cost?
Is Port Monmouth, NJ a buyer’s or seller’s market?
Seller'sMarket
Buyer'sMarket
Port Monmouth is a Buyer's Market
Difference Since June 2024
At the same time last year, Port Monmouth was a Seller's Market.
Port Monmouth is a Buyers Housing Market, which means prices tend to be lower and homes stay on the market longer.
Based on all homes sold in the last 12 months
Homes in Port Monmouth have sold for 14.3% more than they did a year ago.
Summary: The median home sold price in Port Monmouth was $570,500 in June 2025, up 14.3% from last year, and the median price per square foot was $317.
| City | Jun 2024 | Jun 2025 | Change YoY |
|---|---|---|---|
| Port Monmouth | $499K | $570.5K | +14.3% |
| North Middletown | $399.2K | $400K | 0.2% |
| Belford | $570K | $562.5K | -1.3% |
| Beds | Jun 2024 | Jun 2025 | Change YoY |
|---|---|---|---|
| 11 Bedroom | $314K | $185K | -41.1% |
| 22 Bedrooms | $325K | $314.9K | -3.1% |
| 33 Bedrooms | $503K | $475K | -5.6% |
| 44 Bedrooms | $590K | $655K | +11.0% |
| 55+ Bedrooms | $885K | $760K | -14.1% |
Summary: Port Monmouth housing price by bedroom type for June 2025, compared to the previous year. The home price for 1 bedroom homes decreased by -41.1%. The home price for 2 bedroom homes decreased by -3.1%. The home price for 3 bedroom homes decreased by -5.6%. The home price for 4 bedroom homes increased by +11.0%. The home price for 5 bedroom homes decreased by -14.1%.
Market comparison tool
Data and numbers shown are subject to change and may vary based on different timeframes.
Port Monmouth, NJ
How many homes are available in Port Monmouth, NJ?
| Last Month | 2 months ago | Change MoM |
|---|---|---|
| 12Last MonthJun 2025 | ||
| 122 months agoMay 2025 | 0.0 % Change MoMMay – Jun |
Summary: The Port Monmouth real estate market had 12 homes for sale in Jun 2025, the same as May 2025
| Last Month | 2 months ago | Change MoM |
|---|---|---|
| 1Last MonthJun 2025 | ||
| 42 months agoMay 2025 | -75.0 % Change MoMMay – Jun |
| Beds | May 2025 | Jun 2025 | Change MoM |
|---|---|---|---|
| 11 Bedroom | 0 | 0 | 0.0% |
| 22 Bedrooms | 2 | 1 | -50.0% |
| 33 Bedrooms | 3 | 4 | +33.3% |
| 44 Bedrooms | 5 | 6 | +20.0% |
| 55+ Bedrooms | 2 | 1 | -50.0% |
Summary: Port Monmouth housing inventory by bedroom type for June 2025, compared to the previous month. The inventory for 1 bedroom homes remained the same. The inventory for 2 bedroom homes decreased by -50.0%. The inventory for 3 bedroom homes increased by +33.3%. The inventory for 4 bedroom homes increased by +20.0%. The inventory for 5 bedroom homes decreased by -50.0%.
How much do homes in Port Monmouth, NJ cost?
Over Asking Price0 Home
At Asking Price0 Home
Under Asking Price1 Home
If you're buying a home in Port Monmouth, you may be able to get a good deal. 100% of homes here sold below asking price last month.
Summary: A total of 1 homes were sold or pending in Port Monmouth in June 2025, down by 75.0% month-over-month. Of the 1 sold homes, 100% were sold under asking, 0% were sold at asking, and and 0% were sold over asking.
How long does it take to sell a home in Port Monmouth, NJ?
Under 30 Days1 Home
30 – 90 Days0 Home
Over 90 Days0 Home
Many homes in Port Monmouth are selling fast, if you're buying plan to act quickly.
Summary: During June 2025, 1 homes were sold in Port Monmouth; 100% of homes were sold within 30 days, 0% of homes were sold within 30 to 90 days, and 0% of homes were sold over 90 days.
| This Year | 1 year ago | Change YoY |
|---|---|---|
| 17 DaysThis YearJun 2025 | ||
| 17 Days1 year agoJun 2024 | 0.0 % Change YoYJun 2024 – Jun 2025 |
Summary: Homes in Port Monmouth had an average listing age of 17 days in Jun 2025, down by .0% compared to the previous year.
Connect With An Agent
Local real estate agents are ready to help you find a home here
Sell My Home
Sell your home with an expert or get the job done on your own.
Get Approved
Get a customizable mortgage solution based on today's rates.
What homes are available in Port Monmouth, NJ?
#22520676, MaryBeth Tomaro, Listing office: Keller Williams Realty Central Monmouth
#22520251, Bradley Moore, Listing office: O'Brien Realty, LLC
#22513356, Raquel Collaguazo, Listing office: Weichert Realtors-Manalapan
#22518447, Tammy Aversa, Listing office: C21 Thomson & Co.
#22517756, Marli Silver, Listing office: EXP Realty
#22513993, Dale Bisgrove, Listing office: Diane Turton, Realtors-Rumson
#22512653, Christina Kaplun, Listing office: RE/MAX First Realty
#22420779, Brian M Church, Listing office: Berkshire Hathaway HomeServices Fox & Roach - Neptune City
#22420777, Brian M Church, Listing office: Berkshire Hathaway HomeServices Fox & Roach - Neptune City
#2352773M, Listing office: J.J. ELEK REALTY CO.
Nearby markets aren't available for Port Monmouth, NJ
Based on information from Monmouth Ocean Regional MLS, and ALL JERSEY MLS for the period 07/01/2023 - 07/01/2025
 The data relating to real estate for sale on this web site comes in part from the Internet Data exchange (“IDX”) program of the Monmouth/Ocean MLS Monmouth County Association Board of Realtors. IDX information is provided exclusively for consumers' personal, non-commercial use and may not be used for any purpose other than to identify prospective properties consumers may be interested in purchasing. Real estate listings held by other brokerage firms are indicated by detailed information about them such as the name of the listing firms. Information deemed reliable but not guaranteed. Copyright © 2025 Monmouth/Ocean MLS Monmouth County Association Board of Realtors. All Rights Reserved.
 The data relating to real estate for sale on this web-site comes in part from the Internet Listing Display database of the CENTRAL JERSEY MULTIPLE LISTING SYSTEM. Real estate listings held by brokerage firms other than this site-owner are marked with the ILD logo. The CENTRAL JERSEY MULTIPLE LISTING SYSTEM does not warrant the accuracy, quality, reliability, suitability, completeness, usefulness or effectiveness of any information provided. The information being provided is for consumers' personal, non-commercial use and may not be used for any purpose other than to identify properties the consumer may be interested in purchasing or renting. Copyright 2025, CENTRAL JERSEY MULTIPLE LISTING SYSTEM. All Rights Reserved. The CENTRAL JERSEY MULTIPLE LISTING SYSTEM retains all rights, title and interest in and to its trademarks, service marks and copyrighted material.