7 hours on RocketTour

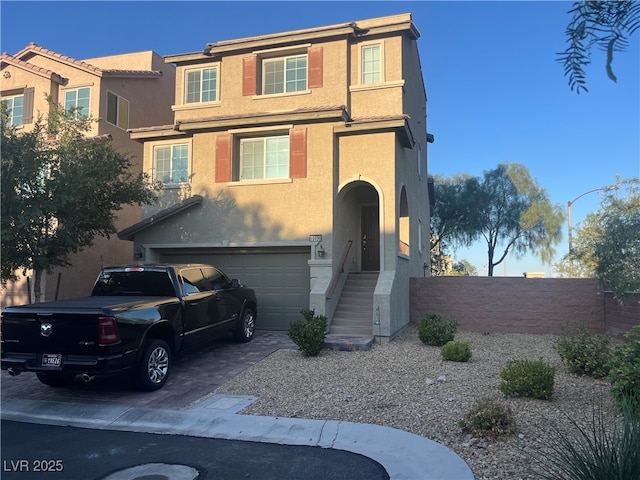
#2705448, Jillian M. Batchelor, Listing office: Real Broker LLC


How much do homes in Enterprise, NV cost?
Is Enterprise, NV a buyer’s or seller’s market?
Seller'sMarket
Buyer'sMarket
Enterprise is a Buyer's Market
Difference Since June 2024
At the same time last year, Enterprise was a Seller's Market.
Enterprise is a Buyers Housing Market, which means prices tend to be lower and homes stay on the market longer.
Based on all homes sold in the last 12 months
Homes in Enterprise have sold for 4.8% more than they did a year ago.
Summary: The median home sold price in Enterprise was $493,871 in June 2025, up 4.8% from last year, and the median price per square foot was $253.
| City | Jun 2024 | Jun 2025 | Change YoY |
|---|---|---|---|
| Southern Highlands | $558.7K | $599.9K | +7.4% |
| Enterprise | $471.2K | $493.8K | +4.8% |
| Beds | Jun 2024 | Jun 2025 | Change YoY |
|---|---|---|---|
| 11 Bedroom | $222K | $223.7K | +0.8% |
| 22 Bedrooms | $315.5K | $321K | +1.8% |
| 33 Bedrooms | $435K | $450K | +3.4% |
| 44 Bedrooms | $530K | $555K | +4.7% |
| 55+ Bedrooms | $716K | $742.7K | +3.7% |
Summary: Enterprise housing price by bedroom type for June 2025, compared to the previous year. The home price for 1 bedroom homes increased by +0.8%. The home price for 2 bedroom homes increased by +1.8%. The home price for 3 bedroom homes increased by +3.4%. The home price for 4 bedroom homes increased by +4.7%. The home price for 5 bedroom homes increased by +3.7%.
Market comparison tool
Data and numbers shown are subject to change and may vary based on different timeframes.
Enterprise, NV
How many homes are available in Enterprise, NV?
| Last Month | 2 months ago | Change MoM |
|---|---|---|
| 1,240Last MonthJun 2025 | ||
| 1,0742 months agoMay 2025 | +15.5 % Change MoMMay – Jun |
Summary: The Enterprise real estate market had 1,240 homes for sale in Jun 2025, a 15.5 % increase compared to May 2025.
| Last Month | 2 months ago | Change MoM |
|---|---|---|
| 169Last MonthJun 2025 | ||
| 1752 months agoMay 2025 | -3.4 % Change MoMMay – Jun |
| Beds | May 2025 | Jun 2025 | Change MoM |
|---|---|---|---|
| 11 Bedroom | 24 | 25 | +4.2% |
| 22 Bedrooms | 112 | 142 | +26.8% |
| 33 Bedrooms | 378 | 419 | +10.8% |
| 44 Bedrooms | 341 | 400 | +17.3% |
| 55+ Bedrooms | 219 | 254 | +16.0% |
Summary: Enterprise housing inventory by bedroom type for June 2025, compared to the previous month. The inventory for 1 bedroom homes increased by +4.2%. The inventory for 2 bedroom homes increased by +26.8%. The inventory for 3 bedroom homes increased by +10.8%. The inventory for 4 bedroom homes increased by +17.3%. The inventory for 5 bedroom homes increased by +16.0%.
How much do homes in Enterprise, NV cost?
Over Asking Price16 Homes
At Asking Price46 Homes
Under Asking Price107 Homes
If you're buying a home in Enterprise, you may be able to get a good deal. 63.3% of homes here sold below asking price last month.
Summary: A total of 169 homes were sold or pending in Enterprise in June 2025, down by 3.4% month-over-month. Of the 169 sold homes, 63% were sold under asking, 27% were sold at asking, and and 9% were sold over asking.
How long does it take to sell a home in Enterprise, NV?
Under 30 Days86 Homes
30 – 90 Days63 Homes
Over 90 Days20 Homes
Many homes in Enterprise are selling fast, if you're buying plan to act quickly.
Summary: During June 2025, 169 homes were sold in Enterprise; 51% of homes were sold within 30 days, 37% of homes were sold within 30 to 90 days, and 12% of homes were sold over 90 days.
| This Year | 1 year ago | Change YoY |
|---|---|---|
| 44 DaysThis YearJun 2025 | ||
| 25 Days1 year agoJun 2024 | +70.4 % Change YoYJun 2024 – Jun 2025 |
Summary: Homes in Enterprise had an average listing age of 44 days in Jun 2025, up by 70.4% compared to the previous year.
Connect With An Agent
Local real estate agents are ready to help you find a home here
Sell My Home
Sell your home with an expert or get the job done on your own.
Get Approved
Get a customizable mortgage solution based on today's rates.
What homes are available in Enterprise, NV?
#2705448, Jillian M. Batchelor, Listing office: Real Broker LLC
#2705609, Shawn M. Preston, Listing office: Insight Property Inc
#2705548, Julie Youngblood, Listing office: Keller Williams Realty Las Veg
#2704358, Yuling Zeng, Listing office: City Villa Realty & Management
#2705200, Jason D. Lindstrom, Listing office: eXp Realty
#2705365, Michelle Bush, Listing office: Keller Williams VIP
#2704282, Ivan Angulo, Listing office: GK Properties
#2705356, Karen Saroukhanoff, Listing office: Robert Realty
#2705332, Claudia N. Kilbride, Listing office: Agent House
#2667528, William O'Keefe, Listing office: eXp Realty
#2705308, Jenny Chuang, Listing office: Rossum Realty Unlimited
#2704987, Craig Tann, Listing office: Huntington & Ellis, A Real Est
Based on information from Greater Las Vegas MLS, for the period 07/01/2023 - 07/01/2025
 Disclaimer: The data relating to real estate for sale on this web site comes in part from the INTERNET DATA EXCHANGE Program of the Greater Las Vegas Association of REALTORS® MLS. Real estate listings held by brokerage firms other than this site owner are marked with the IDX logo. GLVAR MLS deems information reliable but not guaranteed.