7 minutes on Rocket

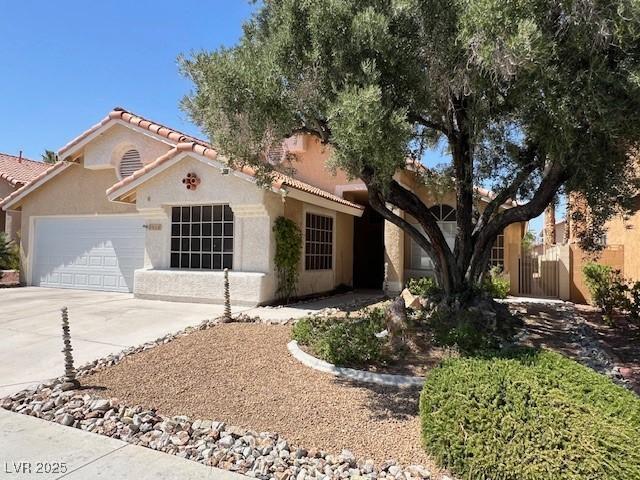
#2699874, Nicole Maroe, Listing office: Simply Vegas


How much do homes in Las Vegas, NV cost?
Is Las Vegas, NV a buyer’s or seller’s market?
Seller'sMarket
Buyer'sMarket
Las Vegas is a Neutral Market
Difference Since June 2024
At the same time last year, Las Vegas was a Seller's Market.
Las Vegas is a Neutral Housing Market, which means prices tend to be reasonable and homes stay on the market for a typical length of time.
Based on all homes sold in the last 12 months
Homes in Las Vegas have sold for 5.1% more than they did a year ago.
Summary: The median home sold price in Las Vegas was $442,751 in June 2025, up 5.1% from last year, and the median price per square foot was $258.
| City | Jun 2024 | Jun 2025 | Change YoY |
|---|---|---|---|
| Clark | $540.5K | $573.6K | +6.1% |
| Las Vegas | $421.2K | $442.7K | +5.1% |
| North Las Vegas | $407.3K | $416.7K | +2.3% |
| Beds | Jun 2024 | Jun 2025 | Change YoY |
|---|---|---|---|
| 11 Bedroom | $204K | $210K | +2.9% |
| 22 Bedrooms | $291.9K | $308.5K | +5.7% |
| 33 Bedrooms | $409.1K | $421.9K | +3.1% |
| 44 Bedrooms | $517K | $540.1K | +4.5% |
| 55+ Bedrooms | $700K | $740K | +5.7% |
Summary: Las Vegas housing price by bedroom type for June 2025, compared to the previous year. The home price for 1 bedroom homes increased by +2.9%. The home price for 2 bedroom homes increased by +5.7%. The home price for 3 bedroom homes increased by +3.1%. The home price for 4 bedroom homes increased by +4.5%. The home price for 5 bedroom homes increased by +5.7%.
Market comparison tool
Data and numbers shown are subject to change and may vary based on different timeframes.
Las Vegas, NV
How many homes are available in Las Vegas, NV?
| Last Month | 2 months ago | Change MoM |
|---|---|---|
| 9,930Last MonthJun 2025 | ||
| 8,9692 months agoMay 2025 | +10.7 % Change MoMMay – Jun |
Summary: The Las Vegas real estate market had 9,930 homes for sale in Jun 2025, a 10.7 % increase compared to May 2025.
| Last Month | 2 months ago | Change MoM |
|---|---|---|
| 1,467Last MonthJun 2025 | ||
| 1,6402 months agoMay 2025 | -10.5 % Change MoMMay – Jun |
| Beds | May 2025 | Jun 2025 | Change MoM |
|---|---|---|---|
| 11 Bedroom | 455 | 492 | +8.1% |
| 22 Bedrooms | 2,101 | 2,343 | +11.5% |
| 33 Bedrooms | 3,266 | 3,550 | +8.7% |
| 44 Bedrooms | 2,159 | 2,440 | +13.0% |
| 55+ Bedrooms | 988 | 1,105 | +11.8% |
Summary: Las Vegas housing inventory by bedroom type for June 2025, compared to the previous month. The inventory for 1 bedroom homes increased by +8.1%. The inventory for 2 bedroom homes increased by +11.5%. The inventory for 3 bedroom homes increased by +8.7%. The inventory for 4 bedroom homes increased by +13.0%. The inventory for 5 bedroom homes increased by +11.8%.
How much do homes in Las Vegas, NV cost?
Over Asking Price238 Homes
At Asking Price382 Homes
Under Asking Price847 Homes
If you're buying a home in Las Vegas, you may be able to get a good deal. 57.7% of homes here sold below asking price last month.
Summary: A total of 1,467 homes were sold or pending in Las Vegas in June 2025, down by 10.5% month-over-month. Of the 1467 sold homes, 58% were sold under asking, 26% were sold at asking, and and 16% were sold over asking.
How long does it take to sell a home in Las Vegas, NV?
Under 30 Days829 Homes
30 – 90 Days477 Homes
Over 90 Days160 Homes
Many homes in Las Vegas are selling fast, if you're buying plan to act quickly.
Summary: During June 2025, 1467 homes were sold in Las Vegas; 57% of homes were sold within 30 days, 33% of homes were sold within 30 to 90 days, and 11% of homes were sold over 90 days.
| This Year | 1 year ago | Change YoY |
|---|---|---|
| 40 DaysThis YearJun 2025 | ||
| 28 Days1 year agoJun 2024 | +43.7 % Change YoYJun 2024 – Jun 2025 |
Summary: Homes in Las Vegas had an average listing age of 40 days in Jun 2025, up by 43.7% compared to the previous year.
Connect With An Agent
Local real estate agents are ready to help you find a home here
Sell My Home
Sell your home with an expert or get the job done on your own.
Get Approved
Get a customizable mortgage solution based on today's rates.
What homes are available in Las Vegas, NV?
#2699874, Nicole Maroe, Listing office: Simply Vegas
#2700423, Cody Trevor Corio, Listing office: LPT Realty, LLC
#2700197, Lynn Schenker, Listing office: ERA Brokers Consolidated
#2700627, Darin Marques, Listing office: Virtue Real Estate Group
#2700613, Wing Sin Yu, Listing office: Nevada Real Estate Corp
#2700382, Jessica L. Beyer, Listing office: Precision Realty
#2700596, John P. McLaury, Listing office: KB Home Nevada Inc
#2700481, Andrea M. Conway, Listing office: THE Brokerage A RE Firm
#2700543, Cecilia Schaaf, Listing office: BHHS Nevada Properties
#2700078, Janet Todrank-Koressel, Listing office: Realty ONE Group, Inc
#2693852, Michael J. Robinson, Listing office: Robinson Realty & Management
#2700201, Don L. Egbert, Listing office: BHHS Nevada Properties
Based on information from Greater Las Vegas MLS, for the period 07/01/2023 - 07/01/2025
 Disclaimer: The data relating to real estate for sale on this web site comes in part from the INTERNET DATA EXCHANGE Program of the Greater Las Vegas Association of REALTORS® MLS. Real estate listings held by brokerage firms other than this site owner are marked with the IDX logo. GLVAR MLS deems information reliable but not guaranteed.