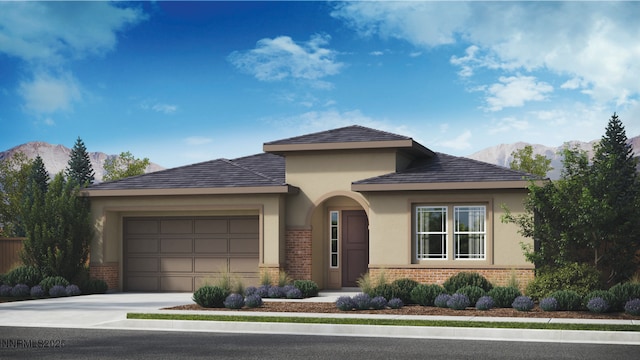
12 hours on Rocket

#250053450, Anita Spencer, Listing office: RE/MAX Professionals-Sparks


How much do homes in Reno, NV cost?
Is Reno, NV a buyer’s or seller’s market?
Seller'sMarket
Buyer'sMarket
Reno is a Seller's Market
Difference Since June 2024
Since last year, Reno has remained a Seller's Market.
Reno is a Sellers Housing Market, which means prices tend to be higher and homes sell faster.
Based on all homes sold in the last 12 months
Homes in Reno have sold for 4.5% more than they did a year ago.
Summary: The median home sold price in Reno was $580,124 in June 2025, up 4.5% from last year, and the median price per square foot was $331.
| City | Jun 2024 | Jun 2025 | Change YoY |
|---|---|---|---|
| Reno Southwest | $784K | $850K | +8.4% |
| Verdi | $740K | $790K | +6.8% |
| Sun Valley | $410K | $430K | +4.9% |
| Reno | $555.3K | $580.1K | +4.5% |
| Reno North | $485K | $475K | -2.1% |
| Beds | Jun 2024 | Jun 2025 | Change YoY |
|---|---|---|---|
| 11 Bedroom | $219K | $216K | -1.4% |
| 22 Bedrooms | $420K | $416K | -0.9% |
| 33 Bedrooms | $538K | $555K | +3.2% |
| 44 Bedrooms | $685K | $740K | +8.0% |
| 55+ Bedrooms | $1.1M | $1.1M | -2.2% |
Summary: Reno housing price by bedroom type for June 2025, compared to the previous year. The home price for 1 bedroom homes decreased by -1.4%. The home price for 2 bedroom homes decreased by -0.9%. The home price for 3 bedroom homes increased by +3.2%. The home price for 4 bedroom homes increased by +8.0%. The home price for 5 bedroom homes decreased by -2.2%.
Market comparison tool
Data and numbers shown are subject to change and may vary based on different timeframes.
Reno, NV
How many homes are available in Reno, NV?
| Last Month | 2 months ago | Change MoM |
|---|---|---|
| 1,740Last MonthJun 2025 | ||
| 1,6182 months agoMay 2025 | +7.5 % Change MoMMay – Jun |
Summary: The Reno real estate market had 1,740 homes for sale in Jun 2025, a 7.5 % increase compared to May 2025.
| Last Month | 2 months ago | Change MoM |
|---|---|---|
| 338Last MonthJun 2025 | ||
| 3322 months agoMay 2025 | +1.8 % Change MoMMay – Jun |
| Beds | May 2025 | Jun 2025 | Change MoM |
|---|---|---|---|
| 11 Bedroom | 98 | 110 | +12.2% |
| 22 Bedrooms | 288 | 292 | +1.4% |
| 33 Bedrooms | 629 | 694 | +10.3% |
| 44 Bedrooms | 452 | 487 | +7.7% |
| 55+ Bedrooms | 151 | 157 | +4.0% |
Summary: Reno housing inventory by bedroom type for June 2025, compared to the previous month. The inventory for 1 bedroom homes increased by +12.2%. The inventory for 2 bedroom homes increased by +1.4%. The inventory for 3 bedroom homes increased by +10.3%. The inventory for 4 bedroom homes increased by +7.7%. The inventory for 5 bedroom homes increased by +4.0%.
How much do homes in Reno, NV cost?
Over Asking Price73 Homes
At Asking Price100 Homes
Under Asking Price165 Homes
If you're buying a home in Reno, you may be able to get a good deal. 48.8% of homes here sold below asking price last month.
Summary: A total of 338 homes were sold or pending in Reno in June 2025, up by 1.8% month-over-month. Of the 338 sold homes, 49% were sold under asking, 30% were sold at asking, and and 22% were sold over asking.
How long does it take to sell a home in Reno, NV?
Under 30 Days34 Homes
30 – 90 Days210 Homes
Over 90 Days94 Homes
Avg time on Rocket Homes in Reno has remained consistent over time.
Summary: During June 2025, 338 homes were sold in Reno; 10% of homes were sold within 30 days, 62% of homes were sold within 30 to 90 days, and 28% of homes were sold over 90 days.
| This Year | 1 year ago | Change YoY |
|---|---|---|
| 85 DaysThis YearJun 2025 | ||
| 74 Days1 year agoJun 2024 | +14.9 % Change YoYJun 2024 – Jun 2025 |
Summary: Homes in Reno had an average listing age of 85 days in Jun 2025, up by 14.9% compared to the previous year.
Connect With An Agent
Local real estate agents are ready to help you find a home here
Sell My Home
Sell your home with an expert or get the job done on your own.
Get Approved
Get a customizable mortgage solution based on today's rates.
What homes are available in Reno, NV?
#250053450, Anita Spencer, Listing office: RE/MAX Professionals-Sparks
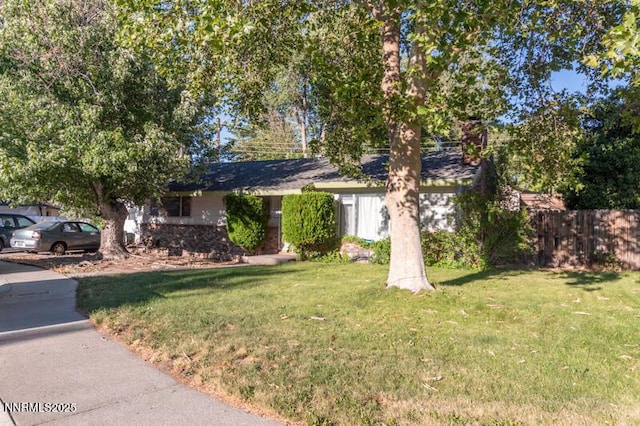
#250053448, Sonja Leonard, Ivy Cohen, Listing office: Dickson Realty - Damonte Ranch, Dickson Realty - Sparks
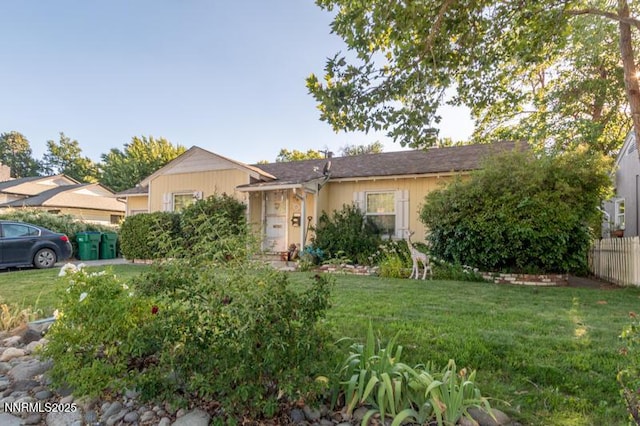
#250053444, Sandra Gabrielli, Listing office: RE/MAX Professionals-Sparks
#250053438, Heather Edwards, Brian Mattison, Listing office: eXp Realty, LLC
#250053436, Rebecca Dickson, Listing office: Dickson Realty - Caughlin
#250053433, Scott Durham, Listing office: Ferrari-Lund Real Estate South
#250053431, Kristina Thyer, Listing office: Jenuane Communities
#250053427, Kyle Carrothers, Listing office: eXp Realty, LLC
#250053414, Angela Beard, Listing office: RE/MAX Gold
#250053413, Holly ODriscoll, Listing office: Chase International-Damonte
#250053412, Kathleen Knuf Felte, Amelia Brush, Listing office: Ferrari-Lund Real Estate Reno
#250053411, Kathleen Knuf Felte, Amelia Brush, Listing office: Ferrari-Lund Real Estate Reno
Nearby markets aren't available for Reno, NV
Based on information from Northern Nevada Regional MLS, and Greater Las Vegas MLS for the period 07/01/2023 - 07/01/2025
 Copyright © 2025 Northern Nevada Regional MLS. All rights reserved.
  Disclaimer: The data relating to real estate for sale on this web site comes in part from the INTERNET DATA EXCHANGE Program of the Greater Las Vegas Association of REALTORS® MLS. Real estate listings held by brokerage firms other than this site owner are marked with the IDX logo. GLVAR MLS deems information reliable but not guaranteed.