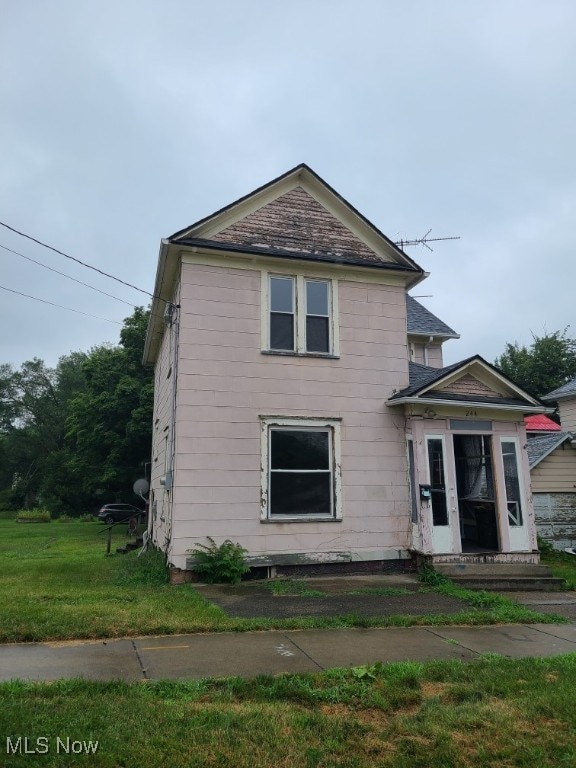
2 hours on Rocket

#5144675, Ashley M Ritchey, Listing office: Kiko


How much do homes in Alliance, OH cost?
Is Alliance, OH a buyer’s or seller’s market?
Seller'sMarket
Buyer'sMarket
Alliance is a Seller's Market
Difference Since June 2024
Since last year, Alliance has remained a Seller's Market.
Alliance is a Sellers Housing Market, which means prices tend to be higher and homes sell faster.
Based on all homes sold in the last 12 months
Homes in Alliance have sold for 11.6% more than they did a year ago.
Summary: The median home sold price in Alliance was $163,500 in June 2025, up 11.6% from last year, and the median price per square foot was $115.
| City | Jun 2024 | Jun 2025 | Change YoY |
|---|---|---|---|
| Alliance | $146.5K | $163.5K | +11.6% |
| Washington Township | $214.9K | $236.2K | +9.9% |
| Lexington Township | $213.4K | $230K | +7.8% |
| Knox Township | $205K | $213.8K | +4.3% |
| Smith Township | $180K | $122.5K | -31.9% |
| Beds | Jun 2024 | Jun 2025 | Change YoY |
|---|---|---|---|
| 11 Bedroom | $50K | $12.5K | -75.0% |
| 22 Bedrooms | $117.5K | $123.6K | +5.2% |
| 33 Bedrooms | $157.2K | $163.5K | +4.0% |
| 44 Bedrooms | $156.9K | $220K | +40.2% |
| 55+ Bedrooms | $178.4K | $236K | +32.3% |
Summary: Alliance housing price by bedroom type for June 2025, compared to the previous year. The home price for 1 bedroom homes decreased by -75.0%. The home price for 2 bedroom homes increased by +5.2%. The home price for 3 bedroom homes increased by +4.0%. The home price for 4 bedroom homes increased by +40.2%. The home price for 5 bedroom homes increased by +32.3%.
Market comparison tool
Data and numbers shown are subject to change and may vary based on different timeframes.
Alliance, OH
How many homes are available in Alliance, OH?
| Last Month | 2 months ago | Change MoM |
|---|---|---|
| 120Last MonthJun 2025 | ||
| 1292 months agoMay 2025 | -7.0 % Change MoMMay – Jun |
Summary: The Alliance real estate market had 120 homes for sale in Jun 2025, a 7.0 % decrease compared to May 2025.
| Last Month | 2 months ago | Change MoM |
|---|---|---|
| 32Last MonthJun 2025 | ||
| 422 months agoMay 2025 | -23.8 % Change MoMMay – Jun |
| Beds | May 2025 | Jun 2025 | Change MoM |
|---|---|---|---|
| 11 Bedroom | 0 | 0 | 0.0% |
| 22 Bedrooms | 26 | 20 | -23.1% |
| 33 Bedrooms | 66 | 65 | -1.5% |
| 44 Bedrooms | 29 | 28 | -3.4% |
| 55+ Bedrooms | 8 | 7 | -12.5% |
Summary: Alliance housing inventory by bedroom type for June 2025, compared to the previous month. The inventory for 1 bedroom homes remained the same. The inventory for 2 bedroom homes decreased by -23.1%. The inventory for 3 bedroom homes decreased by -1.5%. The inventory for 4 bedroom homes decreased by -3.4%. The inventory for 5 bedroom homes decreased by -12.5%.
How much do homes in Alliance, OH cost?
Over Asking Price14 Homes
At Asking Price5 Homes
Under Asking Price13 Homes
If you're buying a home in Alliance, you could pay more than the asking price. 43.8% of homes here sold above asking price last month.
Summary: A total of 32 homes were sold or pending in Alliance in June 2025, down by 23.8% month-over-month. Of the 32 sold homes, 41% were sold under asking, 16% were sold at asking, and and 44% were sold over asking.
How long does it take to sell a home in Alliance, OH?
Under 30 Days18 Homes
30 – 90 Days7 Homes
Over 90 Days7 Homes
Many homes in Alliance are selling fast, if you're buying plan to act quickly.
Summary: During June 2025, 32 homes were sold in Alliance; 56% of homes were sold within 30 days, 22% of homes were sold within 30 to 90 days, and 22% of homes were sold over 90 days.
| This Year | 1 year ago | Change YoY |
|---|---|---|
| 43 DaysThis YearJun 2025 | ||
| 34 Days1 year agoJun 2024 | +26.3 % Change YoYJun 2024 – Jun 2025 |
Summary: Homes in Alliance had an average listing age of 43 days in Jun 2025, up by 26.3% compared to the previous year.
Connect With An Agent
Local real estate agents are ready to help you find a home here
Sell My Home
Sell your home with an expert or get the job done on your own.
Get Approved
Get a customizable mortgage solution based on today's rates.
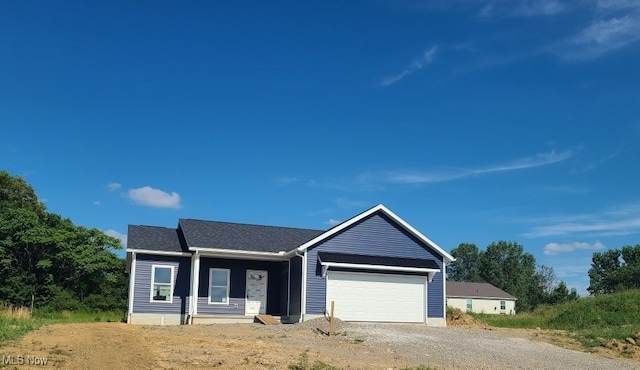
What homes are available in Alliance, OH?
#5144675, Ashley M Ritchey, Listing office: Kiko
#5143715, Talethia Mummertz, Listing office: Keller Williams Legacy Group Realty
#5144527, Jaime M Sina, Listing office: Z Virtual Tour Realty
#5143668, Jennifer K Zeiger, Listing office: RE/MAX Crossroads Properties
#5144499, Lisa M Trummer, Listing office: Tanner Real Estate Co.
#5143587, Haley Armour, Listing office: RE/MAX Edge Realty
#5143867, Doris O Betz, Listing office: Tanner Real Estate Co.
#5142925, Kenny G Mayle, Listing office: RE/MAX Edge Realty
#5142926, Kenny G Mayle, Listing office: RE/MAX Edge Realty
#5142657, Shirley Ryan, Listing office: Tarter Realty
#5142741, Lisa M Trummer, Listing office: Tanner Real Estate Co.
#5142438, Haley Armour, Listing office: RE/MAX Edge Realty
Nearby markets aren't available for Alliance, OH
Based on information from MLS Now, and Mansfield Assocation of REALTORS® MLS for the period 07/01/2023 - 07/01/2025
 Copyright 2025 MLS Now. IDX information is provided exclusively for consumers’ personal, non-commercial use and that it may not be used for any purpose other than to identify prospective properties consumers may be interested in purchasing. Information deemed reliable but not guaranteed to be accurate. Buyer to verify all information. The information provided is for consumers' personal, non-commercial use and may not be used for any purpose other than to identify prospective properties consumers may be interested in purchasing. Real estate listings held by brokerage firms other than this broker are marked with the Internet Data Exchange logo and detailed information about them includes the name of the listing broker(s). The photos may be altered, edited, enhanced or virtually staged.