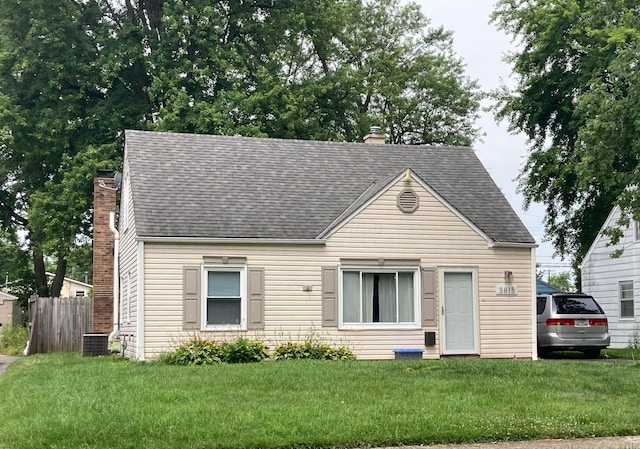
1 day on Rocket
#225025685, Kareem A Jackson, Listing office: Key Realty


How much do homes in North Linden, OH cost?
Is North Linden, OH a buyer’s or seller’s market?
Seller'sMarket
Buyer'sMarket
North Linden is a Seller's Market
Difference Since June 2024
Since last year, North Linden has remained a Seller's Market.
North Linden is a Sellers Housing Market, which means prices tend to be higher and homes sell faster.
Based on all homes sold in the last 12 months
Homes in North Linden have sold for 5.8% more than they did a year ago.
Summary: The median home sold price in North Linden was $179,900 in June 2025, up 5.8% from last year, and the median price per square foot was $159.
| City | Jun 2024 | Jun 2025 | Change YoY |
|---|---|---|---|
| Framingham | $132.5K | $192K | +44.9% |
| North Linden | $170K | $179.9K | +5.8% |
| Mock - Aberdeen | $146.7K | $155K | +5.6% |
| Beds | Jun 2024 | Jun 2025 | Change YoY |
|---|---|---|---|
| 11 Bedroom | $109.5K | $77.7K | -29.0% |
| 22 Bedrooms | $135K | $145K | +7.4% |
| 33 Bedrooms | $180K | $190K | +5.6% |
| 44 Bedrooms | $210.5K | $221K | +5.0% |
| 55+ Bedrooms | $265K | $256.5K | -3.2% |
Summary: North Linden housing price by bedroom type for June 2025, compared to the previous year. The home price for 1 bedroom homes decreased by -29.0%. The home price for 2 bedroom homes increased by +7.4%. The home price for 3 bedroom homes increased by +5.6%. The home price for 4 bedroom homes increased by +5.0%. The home price for 5 bedroom homes decreased by -3.2%.
Market comparison tool
Data and numbers shown are subject to change and may vary based on different timeframes.
North Linden, OH
How many homes are available in North Linden, OH?
| Last Month | 2 months ago | Change MoM |
|---|---|---|
| 191Last MonthJun 2025 | ||
| 1712 months agoMay 2025 | +11.7 % Change MoMMay – Jun |
Summary: The North Linden real estate market had 191 homes for sale in Jun 2025, a 11.7 % increase compared to May 2025.
| Last Month | 2 months ago | Change MoM |
|---|---|---|
| 55Last MonthJun 2025 | ||
| 382 months agoMay 2025 | +44.7 % Change MoMMay – Jun |
| Beds | May 2025 | Jun 2025 | Change MoM |
|---|---|---|---|
| 11 Bedroom | 2 | 0 | -100.0% |
| 22 Bedrooms | 49 | 57 | +16.3% |
| 33 Bedrooms | 104 | 113 | +8.7% |
| 44 Bedrooms | 14 | 18 | +28.6% |
| 55+ Bedrooms | 2 | 3 | +50.0% |
Summary: North Linden housing inventory by bedroom type for June 2025, compared to the previous month. The inventory for 1 bedroom homes decreased by -100.0%. The inventory for 2 bedroom homes increased by +16.3%. The inventory for 3 bedroom homes increased by +8.7%. The inventory for 4 bedroom homes increased by +28.6%. The inventory for 5 bedroom homes increased by +50.0%.
How much do homes in North Linden, OH cost?
Over Asking Price23 Homes
At Asking Price10 Homes
Under Asking Price22 Homes
If you're buying a home in North Linden, you could pay more than the asking price. 41.8% of homes here sold above asking price last month.
Summary: A total of 55 homes were sold or pending in North Linden in June 2025, up by 44.7% month-over-month. Of the 55 sold homes, 40% were sold under asking, 18% were sold at asking, and and 42% were sold over asking.
How long does it take to sell a home in North Linden, OH?
Under 30 Days40 Homes
30 – 90 Days12 Homes
Over 90 Days3 Homes
Many homes in North Linden are selling fast, if you're buying plan to act quickly.
Summary: During June 2025, 55 homes were sold in North Linden; 73% of homes were sold within 30 days, 22% of homes were sold within 30 to 90 days, and 5% of homes were sold over 90 days.
| This Year | 1 year ago | Change YoY |
|---|---|---|
| 24 DaysThis YearJun 2025 | ||
| 20 Days1 year agoJun 2024 | +22.8 % Change YoYJun 2024 – Jun 2025 |
Summary: Homes in North Linden had an average listing age of 24 days in Jun 2025, up by 22.8% compared to the previous year.
Connect With An Agent
Local real estate agents are ready to help you find a home here
Sell My Home
Sell your home with an expert or get the job done on your own.
Get Approved
Get a customizable mortgage solution based on today's rates.
What homes are available in North Linden, OH?
#225025685, Kareem A Jackson, Listing office: Key Realty
#225025380, Barbara S Heicher Gale, Emilie J Hebert, Listing office: Keller Williams Consultants
#225025336, Jessica Vargas, Listing office: EXP Realty, LLC
#225025328, Keith T Poss, Stephanie F Sellers, Listing office: Keller Williams Capital Ptnrs
#225025306, Faith L Hunter, Listing office: Coldwell Banker Realty
#225025254, Jermaine Fox, Lindsey Tinsley, Listing office: EXP Realty, LLC
#225025220, Keith T Poss, Stephanie F Sellers, Listing office: Keller Williams Capital Ptnrs
#225024815, William Pileski, Listing office: Street Smart Realty, LLC
#225024763, Lindsey M Teetor, Listing office: RE/MAX Partners
#225024737, Caitlin D Santill, Listing office: Coldwell Banker Realty
#225024736, Kimberly A Sherrod, Mandy L Harless, Listing office: Keller Williams Greater Cols
#225024710, Trey Abrams, Randy Abrams, Listing office: Red 1 Realty
Nearby markets aren't available for North Linden, OH
Based on information from Columbus and Central Ohio Regional MLS, for the period 07/01/2023 - 07/01/2025
 The information is being provided by Columbus and Central Ohio Regional Multiple Listing Service. Information deemed reliable but not guaranteed. Information is provided for consumers' personal, non-commercial use, and may not be used for any purpose other than the identification of potential properties for purchase.