19 hours on Rocket
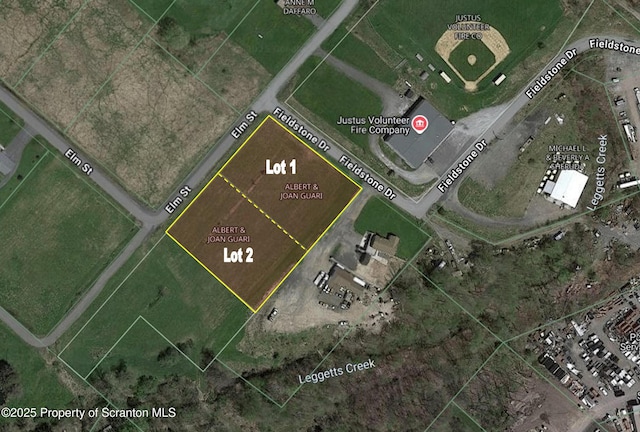
#SC253485, Listing office: ERA One Source Realty


How much do homes in 18411, PA cost?
Is 18411, PA a buyer’s or seller’s market?
Seller'sMarket
Buyer'sMarket
18411 is a Seller's Market
Difference Since June 2024
Since last year, 18411 has remained a Seller's Market.
18411 is a Sellers Housing Market, which means prices tend to be higher and homes sell faster.
Based on all homes sold in the last 12 months
Homes in 18411 have sold for 13.6% more than they did a year ago.
Summary: The median home sold price in 18411 was $340,000 in June 2025, up 13.6% from last year, and the median price per square foot was $162.
| City | Jun 2024 | Jun 2025 | Change YoY |
|---|---|---|---|
| 18414 | $255K | $382.5K | +50.0% |
| 18411 | $299.3K | $340K | +13.6% |
| 18504 | $174.5K | $196K | +12.3% |
| 18508 | $159K | $155K | -2.5% |
| Beds | Jun 2024 | Jun 2025 | Change YoY |
|---|---|---|---|
| 11 Bedroom | - | $180K | N/A |
| 22 Bedrooms | $232K | $270K | +16.4% |
| 33 Bedrooms | $285K | $310K | +8.8% |
| 44 Bedrooms | $402.2K | $413.2K | +2.7% |
| 55+ Bedrooms | $593.5K | $548.7K | -7.5% |
Summary: 18411 housing price by bedroom type for June 2025, compared to the previous year. The home price for 1 bedroom homes did not change. The home price for 2 bedroom homes increased by +16.4%. The home price for 3 bedroom homes increased by +8.8%. The home price for 4 bedroom homes increased by +2.7%. The home price for 5 bedroom homes decreased by -7.5%.
Market comparison tool
Data and numbers shown are subject to change and may vary based on different timeframes.
18411, PA
How many homes are available in 18411, PA?
| Last Month | 2 months ago | Change MoM |
|---|---|---|
| 88Last MonthJun 2025 | ||
| 832 months agoMay 2025 | +6.0 % Change MoMMay – Jun |
Summary: The 18411 real estate market had 88 homes for sale in Jun 2025, a 6.0 % increase compared to May 2025.
| Last Month | 2 months ago | Change MoM |
|---|---|---|
| 29Last MonthJun 2025 | ||
| 172 months agoMay 2025 | +70.6 % Change MoMMay – Jun |
| Beds | May 2025 | Jun 2025 | Change MoM |
|---|---|---|---|
| 11 Bedroom | 1 | 0 | -100.0% |
| 22 Bedrooms | 8 | 5 | -37.5% |
| 33 Bedrooms | 30 | 37 | +23.3% |
| 44 Bedrooms | 28 | 33 | +17.9% |
| 55+ Bedrooms | 16 | 13 | -18.8% |
Summary: 18411 housing inventory by bedroom type for June 2025, compared to the previous month. The inventory for 1 bedroom homes decreased by -100.0%. The inventory for 2 bedroom homes decreased by -37.5%. The inventory for 3 bedroom homes increased by +23.3%. The inventory for 4 bedroom homes increased by +17.9%. The inventory for 5 bedroom homes decreased by -18.8%.
How much do homes in 18411, PA cost?
Over Asking Price8 Homes
At Asking Price1 Home
Under Asking Price20 Homes
If you're buying a home in 18411, you may be able to get a good deal. 69% of homes here sold below asking price last month.
Summary: A total of 29 homes were sold or pending in 18411 in June 2025, up by 70.6% month-over-month. Of the 29 sold homes, 69% were sold under asking, 3% were sold at asking, and and 28% were sold over asking.
How long does it take to sell a home in 18411, PA?
Under 30 Days22 Homes
30 – 90 Days2 Homes
Over 90 Days4 Homes
Many homes in 18411 are selling fast, if you're buying plan to act quickly.
Summary: During June 2025, 29 homes were sold in 18411; 76% of homes were sold within 30 days, 7% of homes were sold within 30 to 90 days, and 14% of homes were sold over 90 days.
| This Year | 1 year ago | Change YoY |
|---|---|---|
| 67 DaysThis YearJun 2025 | ||
| 25 Days1 year agoJun 2024 | +164.3 % Change YoYJun 2024 – Jun 2025 |
Summary: Homes in 18411 had an average listing age of 67 days in Jun 2025, up by 164.3% compared to the previous year.
Connect With An Agent
Local real estate agents are ready to help you find a home here
Sell My Home
Sell your home with an expert or get the job done on your own.
Get Approved
Get a customizable mortgage solution based on today's rates.
What homes are available in 18411, PA?
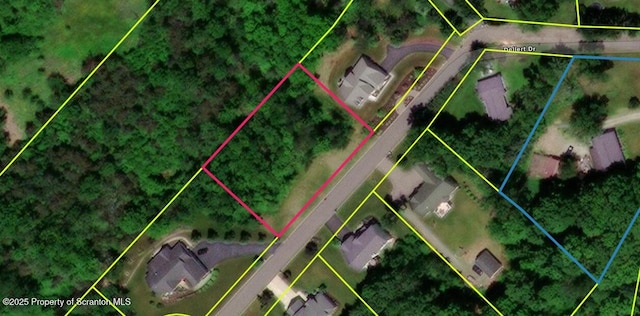
#SC253485, Listing office: ERA One Source Realty
#SC253483, Listing office: Mericle Commercial Real Estate
#SC253481, Listing office: Keller Williams Real Estate-Clarks Summit
#SC253457, Listing office: Hibble Harris Real Estate, Inc
#SC253442, Listing office: Coldwell Banker Town & Country Properties
#SC253383, Listing office: LUXE Homes Real Estate LLC
#SC253315, Listing office: Berkshire Hathaway Home Services Preferred Properties
#SC253266, Listing office: Keller Williams Real Estate-Clarks Summit
#SC253215, Listing office: ERA One Source Realty
#SC253180, Listing office: Revolve Real Estate
#SC253033, Listing office: Classic Properties Kingston
#SC253002, Listing office: Dwell Real Estate
Nearby markets aren't available for 18411, PA
Based on information from Greater Scranton MLS, for the period 07/01/2023 - 07/01/2025
 Listings courtesy of Greater Scranton MLS as distributed by MLS GRID.