1 day on Rocket
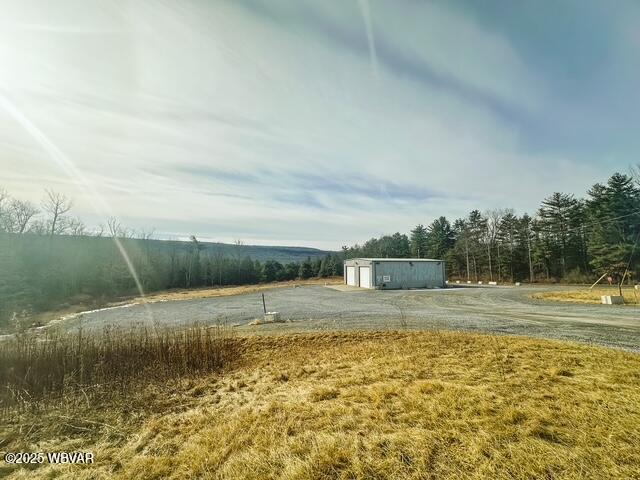
#20-100965, MATTHEW S BERGEY, Listing office: BEILER-CAMPBELL REALTORS


How much do homes in Loganton, PA cost?
Based on all homes listed in the last 12 months
The list price of homes in Loganton has decreased by 5.8% since last year.
Summary: The median home list price in Loganton was $229,900 in June 2025, down 5.8% from the previous year, and the median price per square foot was $147.
| City | Jun 2024 | Jun 2025 | Change YoY |
|---|---|---|---|
| Greene Township | $284.9K | $459K | +61.1% |
| Loganton | $243.9K | $229.9K | -5.8% |
| Beds | Jun 2024 | Jun 2025 | Change YoY |
|---|---|---|---|
| 11 Bedroom | $65K | - | N/A |
| 22 Bedrooms | $158.9K | $134.4K | -15.4% |
| 33 Bedrooms | $244.9K | $334.4K | +36.6% |
| 44 Bedrooms | $241.7K | $314.9K | +30.3% |
| 55+ Bedrooms | $875K | $507.4K | -42.0% |
Summary: Loganton housing price by bedroom type for June 2025, compared to the previous year. The home price for 1 bedroom homes did not change. The home price for 2 bedroom homes decreased by -15.4%. The home price for 3 bedroom homes increased by +36.6%. The home price for 4 bedroom homes increased by +30.3%. The home price for 5 bedroom homes decreased by -42.0%.
Market comparison tool
Data and numbers shown are subject to change and may vary based on different timeframes.
Loganton, PA
How many homes are available in Loganton, PA?
| Last Month | 2 months ago | Change MoM |
|---|---|---|
| 7Last MonthJun 2025 | ||
| 62 months agoMay 2025 | +16.7 % Change MoMMay – Jun |
Summary: The Loganton real estate market had 7 homes for sale in Jun 2025, a 16.7 % increase compared to May 2025.
| Beds | May 2025 | Jun 2025 | Change MoM |
|---|---|---|---|
| 11 Bedroom | 0 | 0 | 0.0% |
| 22 Bedrooms | 1 | 1 | 0.0% |
| 33 Bedrooms | 3 | 3 | 0.0% |
| 44 Bedrooms | 1 | 2 | +100.0% |
| 55+ Bedrooms | 1 | 1 | 0.0% |
Summary: Loganton housing inventory by bedroom type for June 2025, compared to the previous month. The inventory for 1 bedroom homes remained the same. The inventory for 2 bedroom homes remained the same. The inventory for 3 bedroom homes remained the same. The inventory for 4 bedroom homes increased by +100.0%. The inventory for 5 bedroom homes remained the same.
How long does it take to sell a home in Loganton, PA?
| This Year | 1 year ago | Change YoY |
|---|---|---|
| 83 DaysThis YearJun 2025 | ||
| 116 Days1 year agoJun 2024 | -28.3 % Change YoYJun 2024 – Jun 2025 |
Summary: Homes in Loganton had an average listing age of 83 days in Jun 2025, down by 28.3% compared to the previous year.
Connect With An Agent
Local real estate agents are ready to help you find a home here
Sell My Home
Sell your home with an expert or get the job done on your own.
Get Approved
Get a customizable mortgage solution based on today's rates.
What homes are available in Loganton, PA?
#20-100965, MATTHEW S BERGEY, Listing office: BEILER-CAMPBELL REALTORS
#PACL2025216, MATTHEW BERGEY, Listing office: Beiler-Campbell Realtors-Quarryville
#WB-102012, Listing office: Berkshire Hathaway HomeServices Hodrick Realty, WPT
#WB-101776, Listing office: FISH REAL ESTATE
#WB-101502, Listing office: SWC Realty
#WB-101215, Listing office: DAVIS REAL ESTATE INC.
#WB-101146, Listing office: DAVIS REAL ESTATE INC.
#WB-100918, Listing office: Bennett Williams Commercial
Nearby markets aren't available for Loganton, PA
Based on information from West Branch Valley Association of Realtors MLS, BrightMLS, and Central Susquehanna Valley Board of Realtors MLS for the period 07/01/2023 - 07/01/2025
 Information Deemed Reliable But Not Guaranteed. The data relating to real estate for sale on this website appears in part through the BRIGHT Internet Data Exchange program, a voluntary cooperative exchange of property listing data between licensed real estate brokerage firms in which participates, and is provided by BRIGHT through a licensing agreement.