2 hours on Rocket
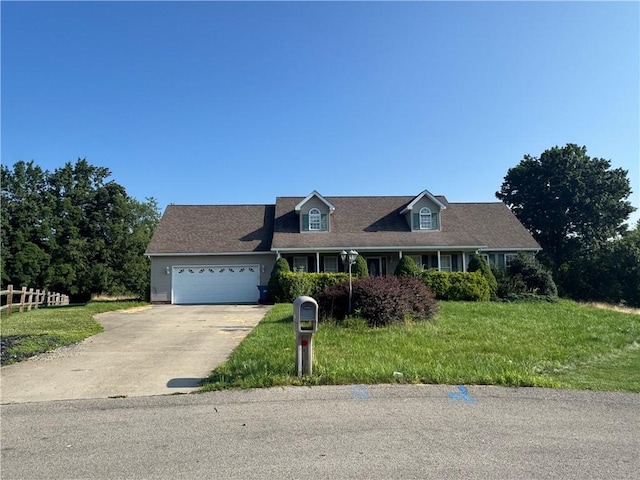
#1712309, Ronalyn Mitcheltree, Listing office: Howard Hanna Real Estate Services


How much do homes in New Castle, PA cost?
Is New Castle, PA a buyer’s or seller’s market?
Seller'sMarket
Buyer'sMarket
New Castle is a Buyer's Market
Difference Since June 2024
At the same time last year, New Castle was a Seller's Market.
New Castle is a Buyers Housing Market, which means prices tend to be lower and homes stay on the market longer.
Based on all homes sold in the last 12 months
Homes in New Castle have sold for 7.7% more than they did a year ago.
Summary: The median home sold price in New Castle was $140,000 in June 2025, up 7.7% from last year, and the median price per square foot was $100.
| City | Jun 2024 | Jun 2025 | Change YoY |
|---|---|---|---|
| Shenango Township | $175K | $215K | +22.9% |
| New Castle | $130K | $140K | +7.7% |
| Neshannock Township | $235K | $228.3K | -2.9% |
| Taylor Township | $234.5K | $204.5K | -12.8% |
| Beds | Jun 2024 | Jun 2025 | Change YoY |
|---|---|---|---|
| 11 Bedroom | $61.4K | $85K | +38.2% |
| 22 Bedrooms | $85K | $110.7K | +30.3% |
| 33 Bedrooms | $139.9K | $139.7K | -0.1% |
| 44 Bedrooms | $158.2K | $212K | +34.0% |
| 55+ Bedrooms | $275K | $399K | +45.1% |
Summary: New Castle housing price by bedroom type for June 2025, compared to the previous year. The home price for 1 bedroom homes increased by +38.2%. The home price for 2 bedroom homes increased by +30.3%. The home price for 3 bedroom homes decreased by -0.1%. The home price for 4 bedroom homes increased by +34.0%. The home price for 5 bedroom homes increased by +45.1%.
Market comparison tool
Data and numbers shown are subject to change and may vary based on different timeframes.
New Castle, PA
How many homes are available in New Castle, PA?
| Last Month | 2 months ago | Change MoM |
|---|---|---|
| 275Last MonthJun 2025 | ||
| 2672 months agoMay 2025 | +3.0 % Change MoMMay – Jun |
Summary: The New Castle real estate market had 275 homes for sale in Jun 2025, a 3.0 % increase compared to May 2025.
| Last Month | 2 months ago | Change MoM |
|---|---|---|
| 39Last MonthJun 2025 | ||
| 522 months agoMay 2025 | -25.0 % Change MoMMay – Jun |
| Beds | May 2025 | Jun 2025 | Change MoM |
|---|---|---|---|
| 11 Bedroom | 1 | 1 | 0.0% |
| 22 Bedrooms | 58 | 58 | 0.0% |
| 33 Bedrooms | 155 | 161 | +3.9% |
| 44 Bedrooms | 38 | 39 | +2.6% |
| 55+ Bedrooms | 15 | 16 | +6.7% |
Summary: New Castle housing inventory by bedroom type for June 2025, compared to the previous month. The inventory for 1 bedroom homes remained the same. The inventory for 2 bedroom homes remained the same. The inventory for 3 bedroom homes increased by +3.9%. The inventory for 4 bedroom homes increased by +2.6%. The inventory for 5 bedroom homes increased by +6.7%.
How much do homes in New Castle, PA cost?
Over Asking Price10 Homes
At Asking Price5 Homes
Under Asking Price24 Homes
If you're buying a home in New Castle, you may be able to get a good deal. 61.5% of homes here sold below asking price last month.
Summary: A total of 39 homes were sold or pending in New Castle in June 2025, down by 25.0% month-over-month. Of the 39 sold homes, 62% were sold under asking, 13% were sold at asking, and and 26% were sold over asking.
How long does it take to sell a home in New Castle, PA?
Under 30 Days15 Homes
30 – 90 Days16 Homes
Over 90 Days8 Homes
Avg time on Rocket Homes in New Castle has remained consistent over time.
Summary: During June 2025, 39 homes were sold in New Castle; 38% of homes were sold within 30 days, 41% of homes were sold within 30 to 90 days, and 21% of homes were sold over 90 days.
| This Year | 1 year ago | Change YoY |
|---|---|---|
| 70 DaysThis YearJun 2025 | ||
| 63 Days1 year agoJun 2024 | +11.1 % Change YoYJun 2024 – Jun 2025 |
Summary: Homes in New Castle had an average listing age of 70 days in Jun 2025, up by 11.1% compared to the previous year.
Connect With An Agent
Local real estate agents are ready to help you find a home here
Sell My Home
Sell your home with an expert or get the job done on your own.
Get Approved
Get a customizable mortgage solution based on today's rates.
What homes are available in New Castle, PA?
#1712309, Ronalyn Mitcheltree, Listing office: Howard Hanna Real Estate Services
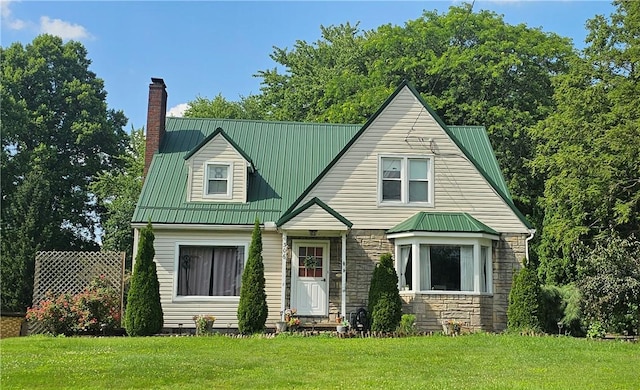
#1711266, Jenifer Cinque, Listing office: Keller Williams Realty
#1711555, Rocco Fazio, Listing office: Compass Pennsylvania, Llc

#PALR2000042, Bradley D. Snouffer, Listing office: American Eagle Realty
#1711730, Elizabeth Fisher, Listing office: Howard Hanna Real Estate Services
#1711833, Patricia Cornrich, Listing office: Castle Realty
#1711720, Anthony Staph Jr, Listing office: Castle Realty
#1711661, Renee Holsapfel, Listing office: Realty One Group Ultimate
#1710947, Eleni Chmura, Listing office: Howard Hanna Real Estate Services
#1711577, William Smulick, Listing office: Berkshire Hathaway The Preferred Realty
#1711545, Gretchen Hammerschmidt, Listing office: Berkshire Hathaway The Preferred Realty
#1711547, Kyree Antonio, Listing office: Berkshire Hathaway The Preferred Realty
Based on information from West Penn Multi-List Inc., and BrightMLS for the period 07/01/2023 - 07/01/2025
 The multiple listing information is provided by West Penn Multi-List, Inc. Information deemed reliable, but not guaranteed. IDX info provided exclusively for consumers’ personal, non-commercial use and may not be used for any purpose other than to identify prospective properties consumers may be interested in purchasing. All properties are subject to prior sale, change, or withdrawal. Listings displaying the IDX logo belong to brokers other than this broker. Neither the listing broker(s) nor this broker or the MLS shall be responsible for any typographical errors, misinformation, misprints, and shall be held totally harmless.
  Information Deemed Reliable But Not Guaranteed. The data relating to real estate for sale on this website appears in part through the BRIGHT Internet Data Exchange program, a voluntary cooperative exchange of property listing data between licensed real estate brokerage firms in which participates, and is provided by BRIGHT through a licensing agreement.