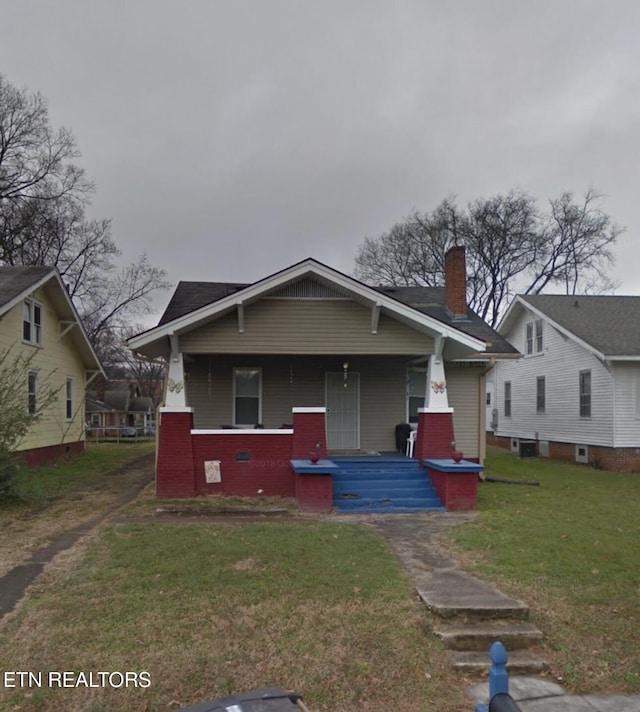
2 days on Rocket
#1308294, Listing office: Greater Impact Realty


How much do homes in Park City, TN cost?
Is Park City, TN a buyer’s or seller’s market?
Seller'sMarket
Buyer'sMarket
Park City is a Buyer's Market
Difference Since June 2024
At the same time last year, Park City was a Seller's Market.
Park City is a Buyers Housing Market, which means prices tend to be lower and homes stay on the market longer.
Based on all homes sold in the last 12 months
Homes in Park City have sold for 8.2% more than they did a year ago.
Summary: The median home sold price in Park City was $213,650 in June 2025, up 8.2% from last year, and the median price per square foot was $193.
| City | Jun 2024 | Jun 2025 | Change YoY |
|---|---|---|---|
| Park City | $197.5K | $213.6K | +8.2% |
| Cold Springs | $220K | $237.7K | +8.1% |
| Parkridge | $294.5K | $282K | -4.2% |
| Beds | Jun 2024 | Jun 2025 | Change YoY |
|---|---|---|---|
| 11 Bedroom | - | $145K | N/A |
| 22 Bedrooms | $181.5K | $165K | -9.1% |
| 33 Bedrooms | $220K | $219.9K | 0.0% |
| 44 Bedrooms | $280K | $220.5K | -21.3% |
| 55+ Bedrooms | - | $310K | N/A |
Summary: Park City housing price by bedroom type for June 2025, compared to the previous year. The home price for 1 bedroom homes did not change. The home price for 2 bedroom homes decreased by -9.1%. The home price for 3 bedroom homes decreased by 0.0%. The home price for 4 bedroom homes decreased by -21.3%. The home price for 5 bedroom homes did not change.
Market comparison tool
Data and numbers shown are subject to change and may vary based on different timeframes.
Park City, TN
How many homes are available in Park City, TN?
| Last Month | 2 months ago | Change MoM |
|---|---|---|
| 32Last MonthJun 2025 | ||
| 272 months agoMay 2025 | +18.5 % Change MoMMay – Jun |
Summary: The Park City real estate market had 32 homes for sale in Jun 2025, a 18.5 % increase compared to May 2025.
| Last Month | 2 months ago | Change MoM |
|---|---|---|
| 3Last MonthJun 2025 | ||
| 32 months agoMay 2025 | 0.0 % Change MoMMay – Jun |
| Beds | May 2025 | Jun 2025 | Change MoM |
|---|---|---|---|
| 11 Bedroom | 0 | 0 | 0.0% |
| 22 Bedrooms | 5 | 7 | +40.0% |
| 33 Bedrooms | 16 | 20 | +25.0% |
| 44 Bedrooms | 5 | 5 | 0.0% |
| 55+ Bedrooms | 1 | 0 | -100.0% |
Summary: Park City housing inventory by bedroom type for June 2025, compared to the previous month. The inventory for 1 bedroom homes remained the same. The inventory for 2 bedroom homes increased by +40.0%. The inventory for 3 bedroom homes increased by +25.0%. The inventory for 4 bedroom homes remained the same. The inventory for 5 bedroom homes decreased by -100.0%.
How much do homes in Park City, TN cost?
Over Asking Price0 Home
At Asking Price3 Homes
Under Asking Price0 Home
If you're buying a home in Park City, expect to pay close to the asking price. 100% of homes here sold near the asking price last month.
Summary: A total of 3 homes were sold or pending in Park City in June 2025, the same as the previous month. Of the 3 sold homes, 0% were sold under asking, 100% were sold at asking, and and 0% were sold over asking.
How long does it take to sell a home in Park City, TN?
Under 30 Days1 Home
30 – 90 Days0 Home
Over 90 Days2 Homes
Most homes in Park City are taking a long time to sell, it's a good idea to negotiate on homes here.
Summary: During June 2025, 3 homes were sold in Park City; 33% of homes were sold within 30 days, 0% of homes were sold within 30 to 90 days, and 67% of homes were sold over 90 days.
| This Year | 1 year ago | Change YoY |
|---|---|---|
| 91 DaysThis YearJun 2025 | ||
| 26 Days1 year agoJun 2024 | +250.3 % Change YoYJun 2024 – Jun 2025 |
Summary: Homes in Park City had an average listing age of 91 days in Jun 2025, up by 250.3% compared to the previous year.
Connect With An Agent
Local real estate agents are ready to help you find a home here
Sell My Home
Sell your home with an expert or get the job done on your own.
Get Approved
Get a customizable mortgage solution based on today's rates.
What homes are available in Park City, TN?
#1308294, Listing office: Greater Impact Realty
#1307887, Listing office: MaX House brokered eXp
#1307402, Listing office: Realty Executives Knox Valley
#1307040, Listing office: Wallace
#1307106, Listing office: Wallace
#1306780, Listing office: MaX House brokered eXp
#1306481, Listing office: Weichert REALTORS Advantage Plus
#1306406, Listing office: Wallace
#1306268, Listing office: Elite Realty
#1306189, Listing office: eXp Realty, LLC
#1306178, Listing office: Crye-Leike Realtors South, Inc.
#2921307, Jennifer Montgomery, Listing office: Wallace
Nearby markets aren't available for Park City, TN
Based on information from East Tennessee REALTORS® MLS, and RealTracs Middle Tennessee Regional MLS for the period 07/01/2023 - 07/01/2025
 The data relating to real estate for sale on this web site comes in part from the Internet Data exchange (“IDX”) program of the Knoxville Area Association of REALTORS® Multiple Listing Service. IDX information is provided exclusively for consumers' personal, non-commercial use and may not be used for any purpose other than to identify prospective properties consumers may be interested in purchasing. Some or all of the listings may not belong to the firm whose website is being visited. Real estate listings held by brokerage firms other than this broker are indicated by detailed information about them such as the name of the listing firms.
  Listings courtesy of RealTracs Middle Tennessee Regional MLS as distributed by MLS GRID.
 © 2025 of the REALTRACS MLS. All rights Reserved.