Coming soon

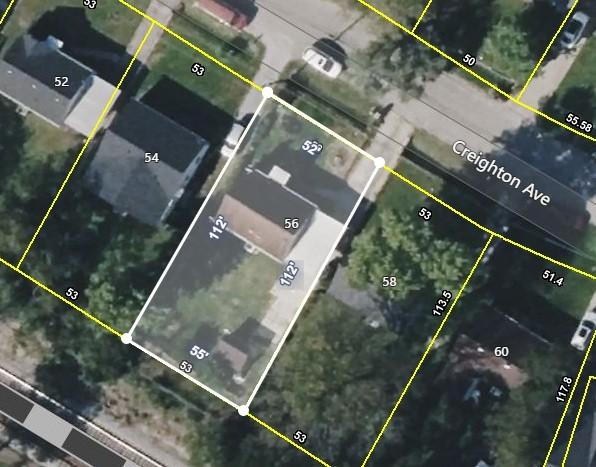
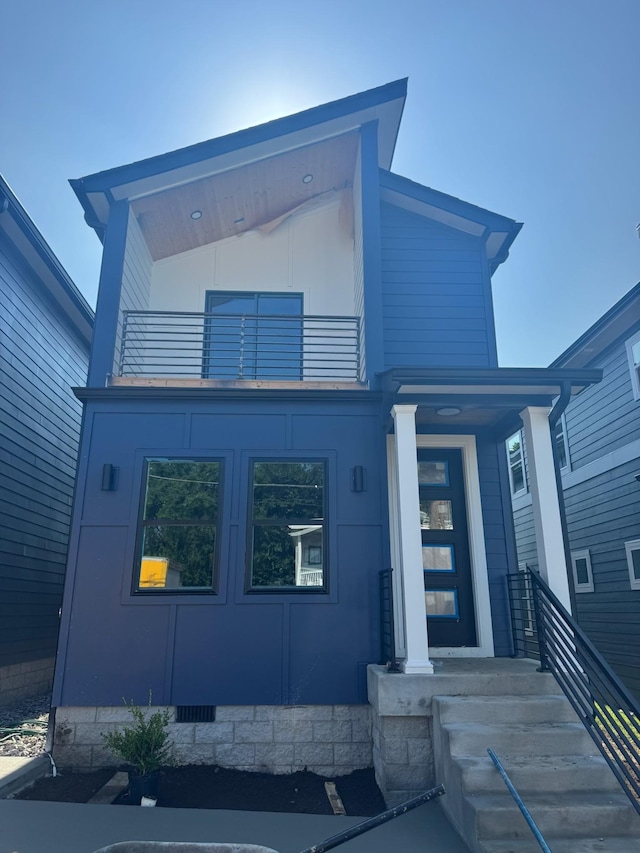
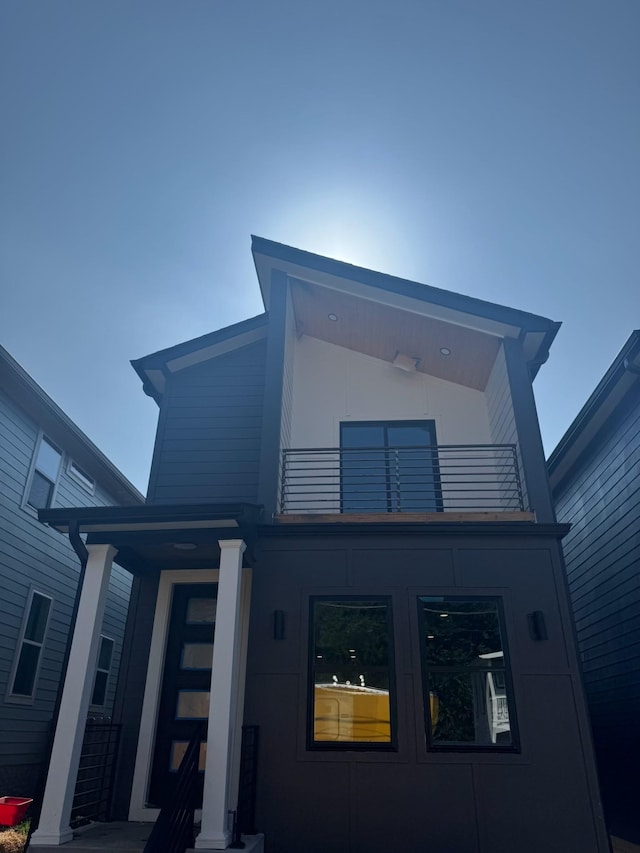
#2946821, Alex Vargas, Listing office: Benchmark Realty, LLC


How much do homes in South Inglewood, TN cost?
Is South Inglewood, TN a buyer’s or seller’s market?
Seller'sMarket
Buyer'sMarket
South Inglewood is a Seller's Market
Difference Since June 2024
Since last year, South Inglewood has remained a Seller's Market.
South Inglewood is a Sellers Housing Market, which means prices tend to be higher and homes sell faster.
Based on all homes sold in the last 12 months
The sold price of homes in South Inglewood has remained the same since last year.
Summary: The median home sold price in South Inglewood was $582,500 in June 2025, up 0.4% from last year, and the median price per square foot was $324.
| City | Jun 2024 | Jun 2025 | Change YoY |
|---|---|---|---|
| Eastwood | $591.2K | $700K | +18.4% |
| East Nashville | $550K | $595K | +8.2% |
| South Inglewood | $580K | $582.5K | 0.4% |
| Beds | Jun 2024 | Jun 2025 | Change YoY |
|---|---|---|---|
| 11 Bedroom | $283.7K | - | N/A |
| 22 Bedrooms | $401.1K | $395.5K | -1.4% |
| 33 Bedrooms | $580K | $582.5K | 0.4% |
| 44 Bedrooms | $770K | $717K | -6.9% |
| 55+ Bedrooms | $813K | $803.6K | -1.2% |
Summary: South Inglewood housing price by bedroom type for June 2025, compared to the previous year. The home price for 1 bedroom homes did not change. The home price for 2 bedroom homes decreased by -1.4%. The home price for 3 bedroom homes increased by 0.4%. The home price for 4 bedroom homes decreased by -6.9%. The home price for 5 bedroom homes decreased by -1.2%.
Market comparison tool
Data and numbers shown are subject to change and may vary based on different timeframes.
South Inglewood, TN
How many homes are available in South Inglewood, TN?
| Last Month | 2 months ago | Change MoM |
|---|---|---|
| 75Last MonthJun 2025 | ||
| 782 months agoMay 2025 | -3.8 % Change MoMMay – Jun |
Summary: The South Inglewood real estate market had 75 homes for sale in Jun 2025, a 3.8 % decrease compared to May 2025.
| Last Month | 2 months ago | Change MoM |
|---|---|---|
| 14Last MonthJun 2025 | ||
| 212 months agoMay 2025 | -33.3 % Change MoMMay – Jun |
| Beds | May 2025 | Jun 2025 | Change MoM |
|---|---|---|---|
| 11 Bedroom | 3 | 4 | +33.3% |
| 22 Bedrooms | 8 | 9 | +12.5% |
| 33 Bedrooms | 35 | 30 | -14.3% |
| 44 Bedrooms | 29 | 30 | +3.4% |
| 55+ Bedrooms | 3 | 2 | -33.3% |
Summary: South Inglewood housing inventory by bedroom type for June 2025, compared to the previous month. The inventory for 1 bedroom homes increased by +33.3%. The inventory for 2 bedroom homes increased by +12.5%. The inventory for 3 bedroom homes decreased by -14.3%. The inventory for 4 bedroom homes increased by +3.4%. The inventory for 5 bedroom homes decreased by -33.3%.
How much do homes in South Inglewood, TN cost?
Over Asking Price2 Homes
At Asking Price4 Homes
Under Asking Price8 Homes
If you're buying a home in South Inglewood, you may be able to get a good deal. 57.1% of homes here sold below asking price last month.
Summary: A total of 14 homes were sold or pending in South Inglewood in June 2025, down by 33.3% month-over-month. Of the 14 sold homes, 57% were sold under asking, 29% were sold at asking, and and 14% were sold over asking.
How long does it take to sell a home in South Inglewood, TN?
Under 30 Days11 Homes
30 – 90 Days3 Homes
Over 90 Days0 Home
Many homes in South Inglewood are selling fast, if you're buying plan to act quickly.
Summary: During June 2025, 14 homes were sold in South Inglewood; 79% of homes were sold within 30 days, 21% of homes were sold within 30 to 90 days, and 0% of homes were sold over 90 days.
| This Year | 1 year ago | Change YoY |
|---|---|---|
| 19 DaysThis YearJun 2025 | ||
| 12 Days1 year agoJun 2024 | +53.5 % Change YoYJun 2024 – Jun 2025 |
Summary: Homes in South Inglewood had an average listing age of 19 days in Jun 2025, up by 53.5% compared to the previous year.
Connect With An Agent
Local real estate agents are ready to help you find a home here
Sell My Home
Sell your home with an expert or get the job done on your own.
Get Approved
Get a customizable mortgage solution based on today's rates.
What homes are available in South Inglewood, TN?
#2946821, Alex Vargas, Listing office: Benchmark Realty, LLC
#2946258, April Harrington, Listing office: Exit Real Estate Experts
#2946202, Charlie Fenner, Listing office: Equity Capital, LLC
#2946194, Peter Lewis, Listing office: simpliHOM
#2946193, Peter Lewis, Listing office: simpliHOM
#2944410, Chasity Boehm, Listing office: Haven Real Estate
#2944210, Charlie Fenner, Listing office: Equity Capital, LLC
#2943599, Andrew (Drew) Evans, Listing office: The Sapphire Group Real Estate
#2943621, Ruby Elshafei, Listing office: Fridrich & Clark Realty
#2943198, Dean Nelson, Listing office: eXp Realty
#2941842, Bernie Gallerani, Listing office: Bernie Gallerani Real Estate
#2941745, Sylvia McCormick, Listing office: Live Nashville Realty. LLC
Based on information from RealTracs Middle Tennessee Regional MLS, for the period 07/01/2023 - 07/01/2025
 Listings courtesy of RealTracs Middle Tennessee Regional MLS as distributed by MLS GRID.
 © 2025 of the REALTRACS MLS. All rights Reserved.