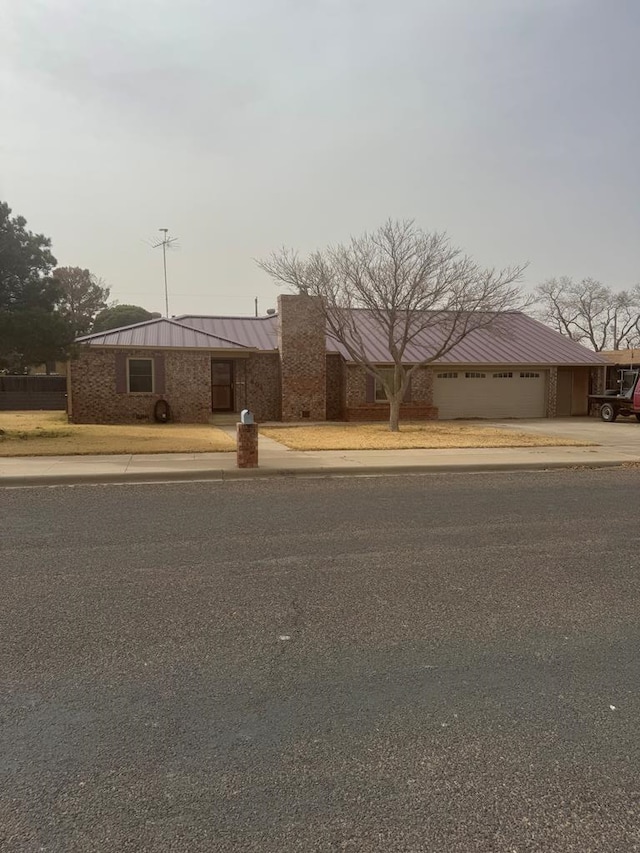
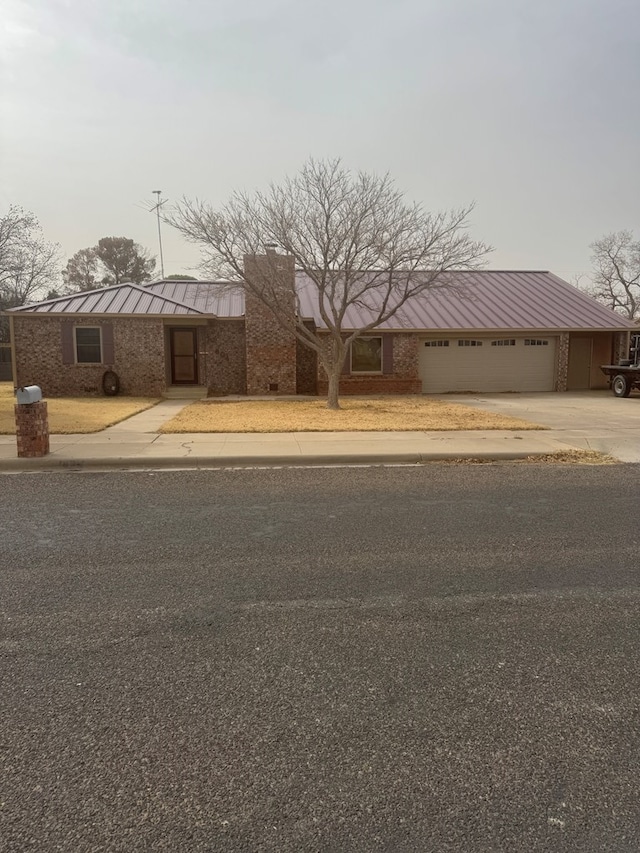
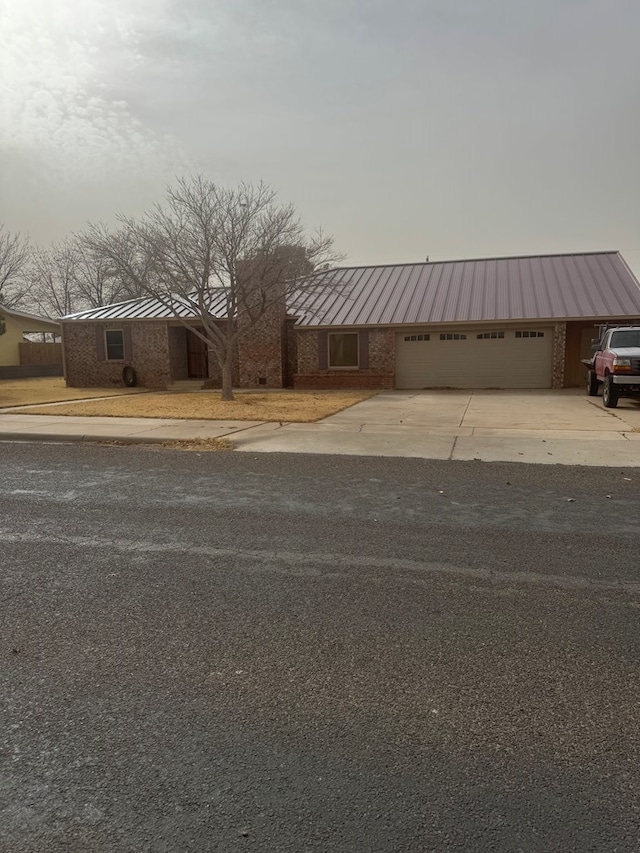
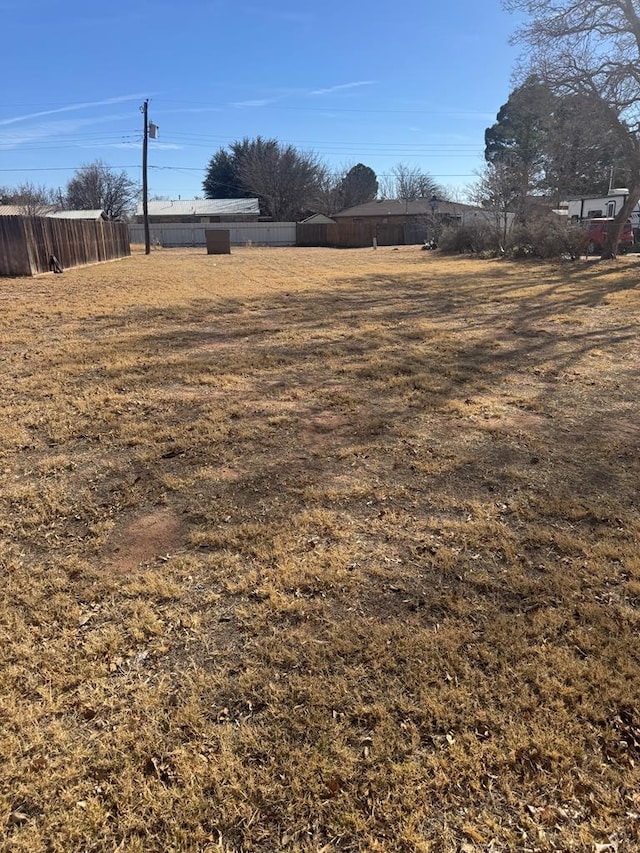
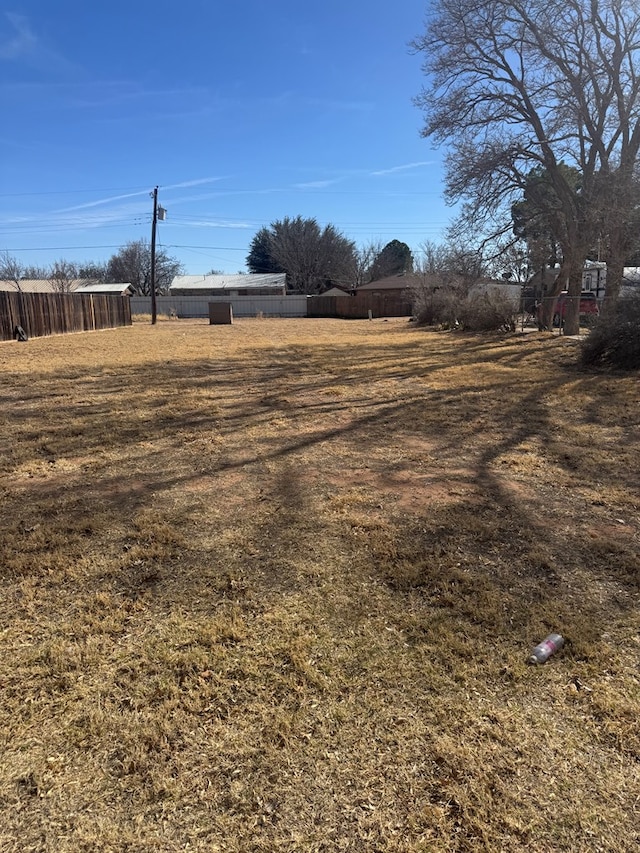
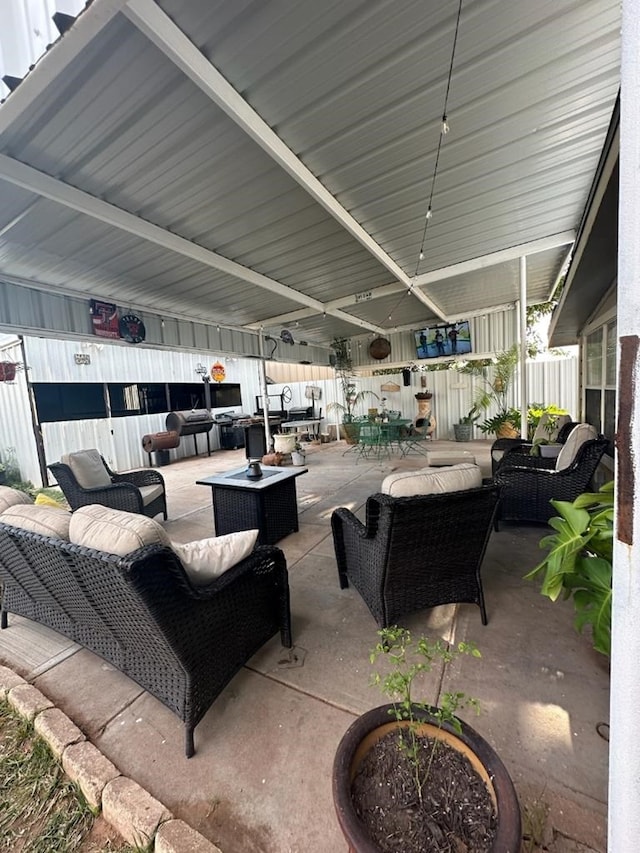
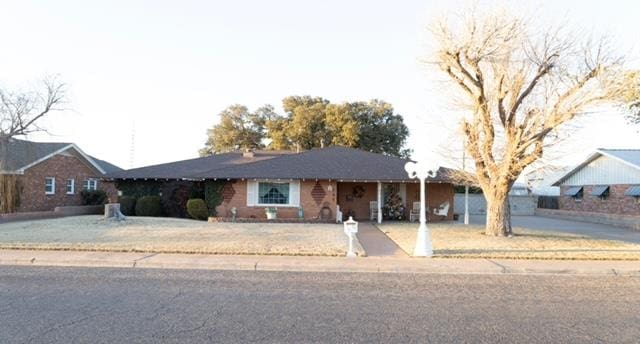
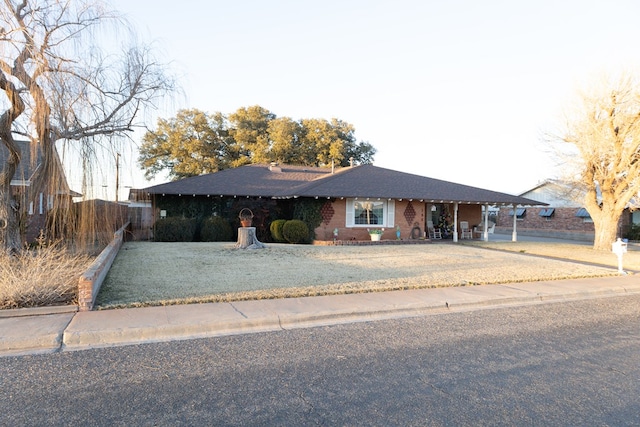
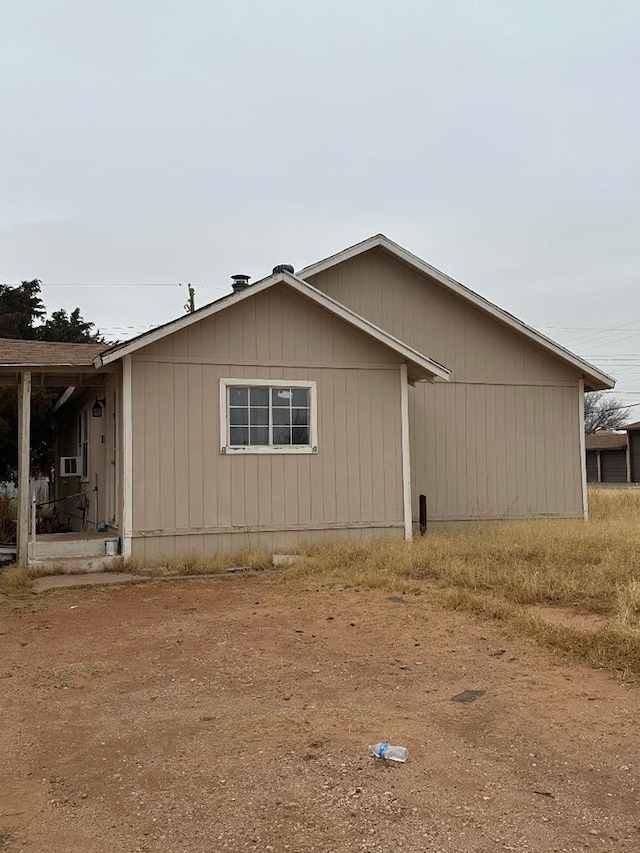
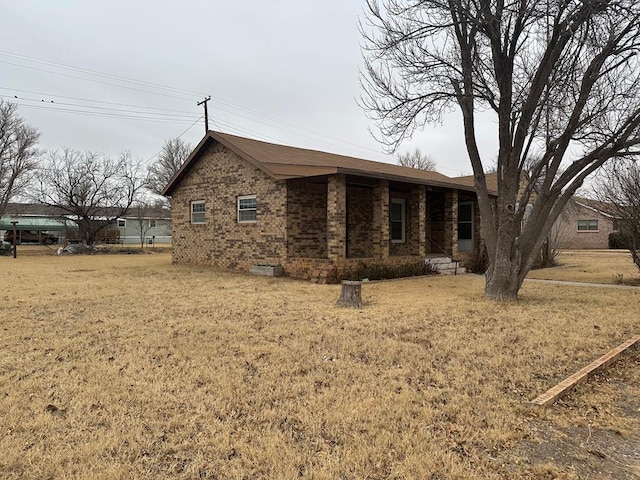
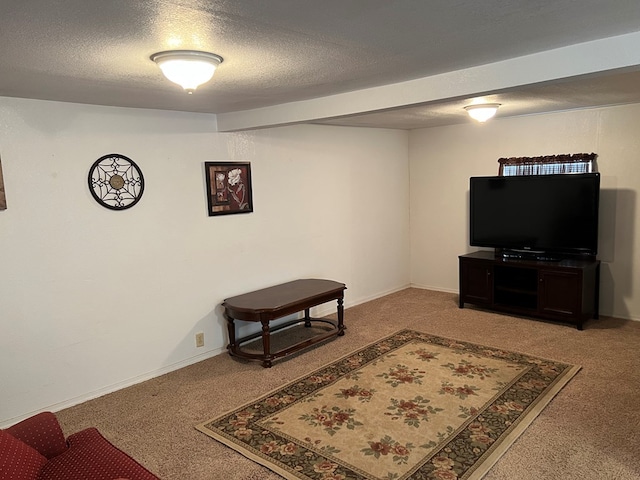
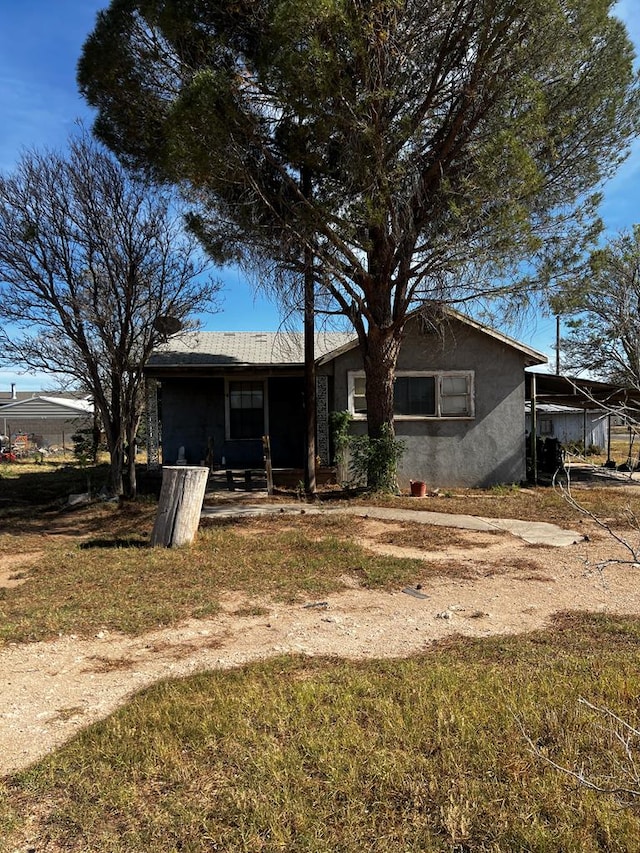
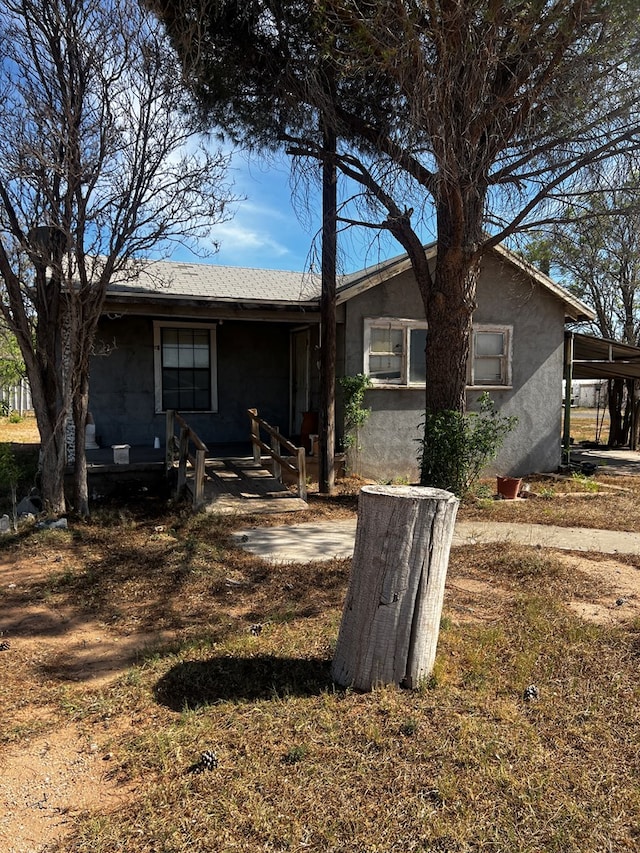
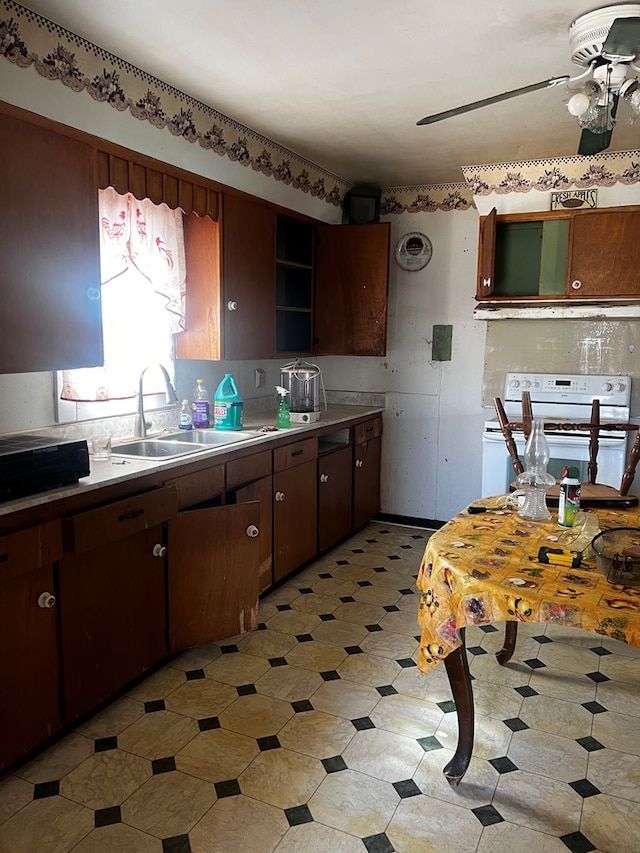
$3,146 Closing Credit¹
#157507, Denise Park, Listing Office: All City Real Estate Ltd. Co.


How much do homes in Crane County, TX cost?
Based on all homes listed in February 2025
The list price of homes in Crane County has increased by 3.3% since January.
Summary: The median home list price in Crane County was $232,450 in February 2025, up 3.3% from the previous month, and the median price per square foot was $128.
| City | Jan 2025 | Feb 2025 | Change MoM |
|---|---|---|---|
| Crane County | $225K | $232.4K | +3.3% |
| Ector County | $291.4K | $299.3K | +2.7% |
| Upton County | $175K | $172K | -1.7% |
| Beds | Jan 2025 | Feb 2025 | Change MoM |
|---|---|---|---|
| 11 Bedroom | - | - | N/A |
| 22 Bedrooms | $110K | $130K | +18.2% |
| 33 Bedrooms | $239.9K | $239.9K | 0.0% |
| 44 Bedrooms | $237.4K | $237.4K | 0.0% |
| 55+ Bedrooms | - | - | N/A |
Summary: Crane County housing price by bedroom type for February 2025, compared to the previous month. The home price for 1 bedroom homes did not change. The home price for 2 bedroom homes increased by +18.2%. The home price for 3 bedroom homes did not change. The home price for 4 bedroom homes did not change. The home price for 5 bedroom homes did not change.
How many homes are available in Crane County, TX?
| Last Month | 2 months ago | Change MoM |
|---|---|---|
| 14Last MonthFeb 2025 | ||
| 112 months agoJan 2025 | +27.3 % Change MoMJan – Feb |
Summary: The Crane County real estate market had 14 homes for sale in Feb 2025, a 27.3 % increase compared to Jan 2025.
| Beds | Jan 2025 | Feb 2025 | Change MoM |
|---|---|---|---|
| 11 Bedroom | 0 | 0 | 0.0% |
| 22 Bedrooms | 2 | 3 | +50.0% |
| 33 Bedrooms | 7 | 9 | +28.6% |
| 44 Bedrooms | 2 | 2 | 0.0% |
| 55+ Bedrooms | 0 | 0 | 0.0% |
Summary: Crane County housing inventory by bedroom type for February 2025, compared to the previous month. The inventory for 1 bedroom homes remained the same. The inventory for 2 bedroom homes increased by +50.0%. The inventory for 3 bedroom homes increased by +28.6%. The inventory for 4 bedroom homes remained the same. The inventory for 5 bedroom homes remained the same.
How much do homes in Crane County, TX cost?
Over Asking Price1 Home
At Asking Price0 Home
Under Asking Price2 Homes
If you're buying a home in Crane County, you may be able to get a good deal. 66.7% of homes here sold below asking price last month.
Summary: A total of 3 homes were sold or pending in Crane County in February 2025, up by 100.0% month-over-month. Of the 3 sold homes, 67% were sold under asking, 0% were sold at asking, and and 33% were sold over asking.
How long does it take to sell a home in Crane County, TX?
Under 30 Days2 Homes
30 – 90 Days0 Home
Over 90 Days1 Home
Many homes in Crane County are selling fast, if you're buying plan to act quickly.
Summary: During February 2025, 3 homes were sold in Crane County; 67% of homes were sold within 30 days, 0% of homes were sold within 30 to 90 days, and 33% of homes were sold over 90 days.
| Last Month | 1 month ago | Change MoM |
|---|---|---|
| 104 DaysLast MonthFeb 2025 | ||
| 105 Days1 month agoJan 2025 | -1.0 % Change MoMJan – Feb |
Summary: Homes in Crane County had an average listing age of 104 days in Feb 2025, down by 1.0% compared to the previous month.
Connect With An Agent
Local real estate agents are ready to help you find a home here
Sell My Home
Sell your home with an expert or get the job done on your own.
Get Approved
Get a customizable mortgage solution based on today's rates.
What homes are available in Crane County, TX?
#157507, Denise Park, Listing Office: All City Real Estate Ltd. Co.
#158116, Denise Park, Listing Office: All City Real Estate Ltd. Co.

#157866, Arlene Dominguez, Listing Office: All City Real Estate Ltd. Co.

#157834, Vanessa Navarrete, Listing Office: Strait A Real Estate
#157694, Vanessa Navarrete, Listing Office: Strait A Real Estate
#157693, Vanessa Navarrete, Listing Office: Strait A Real Estate
#156892, Gena Norvell, Listing Office: Crane Realty
#150603, Maria Bedoy, Listing Office: All City Real Estate Ltd. Co.
Based on information from Odessa MLS, for the period 01/01/2025 - 03/01/2025