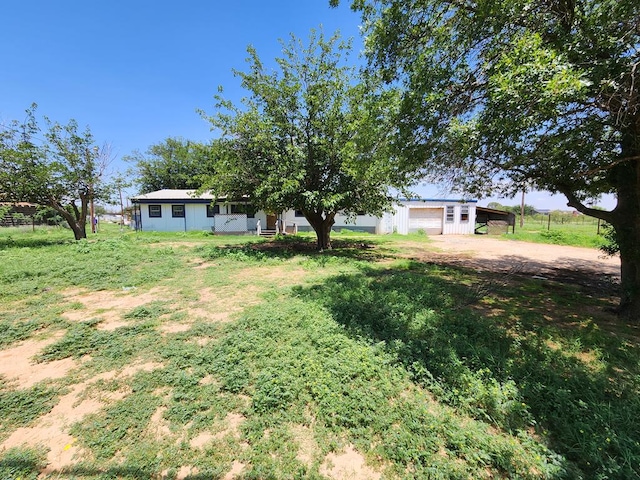
46 minutes on Rocket
#50084058, Tracy Farrow, Listing office: Tracy Farrow Realty


How much do homes in Midland South, TX cost?
Is Midland South, TX a buyer’s or seller’s market?
Seller'sMarket
Buyer'sMarket
Midland South is a Buyer's Market
Difference Since June 2024
At the same time last year, Midland South was a Seller's Market.
Midland South is a Buyers Housing Market, which means prices tend to be lower and homes stay on the market longer.
Based on all homes sold in the last 12 months
Homes in Midland South have sold for 3.5% more than they did a year ago.
Summary: The median home sold price in Midland South was $517,500 in June 2025, up 3.5% from last year, and the median price per square foot was $237.
| City | Jun 2024 | Jun 2025 | Change YoY |
|---|---|---|---|
| Odessa | $275K | $305K | +10.9% |
| Midland | $345K | $369K | +7.0% |
| Midland South | $500K | $517.5K | +3.5% |
| Beds | Jun 2024 | Jun 2025 | Change YoY |
|---|---|---|---|
| 11 Bedroom | - | - | N/A |
| 22 Bedrooms | $260K | $279K | +7.3% |
| 33 Bedrooms | $365K | $419K | +14.8% |
| 44 Bedrooms | $594.5K | $560K | -5.8% |
| 55+ Bedrooms | $965K | $750K | -22.3% |
Summary: Midland South housing price by bedroom type for June 2025, compared to the previous year. The home price for 1 bedroom homes did not change. The home price for 2 bedroom homes increased by +7.3%. The home price for 3 bedroom homes increased by +14.8%. The home price for 4 bedroom homes decreased by -5.8%. The home price for 5 bedroom homes decreased by -22.3%.
Market comparison tool
Data and numbers shown are subject to change and may vary based on different timeframes.
Midland South, TX
How many homes are available in Midland South, TX?
| Last Month | 2 months ago | Change MoM |
|---|---|---|
| 129Last MonthJun 2025 | ||
| 1032 months agoMay 2025 | +25.2 % Change MoMMay – Jun |
Summary: The Midland South real estate market had 129 homes for sale in Jun 2025, a 25.2 % increase compared to May 2025.
| Last Month | 2 months ago | Change MoM |
|---|---|---|
| 15Last MonthJun 2025 | ||
| 142 months agoMay 2025 | +7.1 % Change MoMMay – Jun |
| Beds | May 2025 | Jun 2025 | Change MoM |
|---|---|---|---|
| 11 Bedroom | 0 | 1 | +100.0% |
| 22 Bedrooms | 3 | 3 | 0.0% |
| 33 Bedrooms | 32 | 41 | +28.1% |
| 44 Bedrooms | 58 | 69 | +19.0% |
| 55+ Bedrooms | 10 | 15 | +50.0% |
Summary: Midland South housing inventory by bedroom type for June 2025, compared to the previous month. The inventory for 1 bedroom homes increased by +100.0%. The inventory for 2 bedroom homes remained the same. The inventory for 3 bedroom homes increased by +28.1%. The inventory for 4 bedroom homes increased by +19.0%. The inventory for 5 bedroom homes increased by +50.0%.
How much do homes in Midland South, TX cost?
Over Asking Price2 Homes
At Asking Price5 Homes
Under Asking Price8 Homes
If you're buying a home in Midland South, you may be able to get a good deal. 53.3% of homes here sold below asking price last month.
Summary: A total of 15 homes were sold or pending in Midland South in June 2025, up by 7.1% month-over-month. Of the 15 sold homes, 53% were sold under asking, 33% were sold at asking, and and 13% were sold over asking.
How long does it take to sell a home in Midland South, TX?
Under 30 Days7 Homes
30 – 90 Days6 Homes
Over 90 Days2 Homes
Many homes in Midland South are selling fast, if you're buying plan to act quickly.
Summary: During June 2025, 15 homes were sold in Midland South; 47% of homes were sold within 30 days, 40% of homes were sold within 30 to 90 days, and 13% of homes were sold over 90 days.
| This Year | 1 year ago | Change YoY |
|---|---|---|
| 51 DaysThis YearJun 2025 | ||
| 45 Days1 year agoJun 2024 | +12.3 % Change YoYJun 2024 – Jun 2025 |
Summary: Homes in Midland South had an average listing age of 51 days in Jun 2025, up by 12.3% compared to the previous year.
Connect With An Agent
Local real estate agents are ready to help you find a home here
Sell My Home
Sell your home with an expert or get the job done on your own.
Get Approved
Get a customizable mortgage solution based on today's rates.
What homes are available in Midland South, TX?
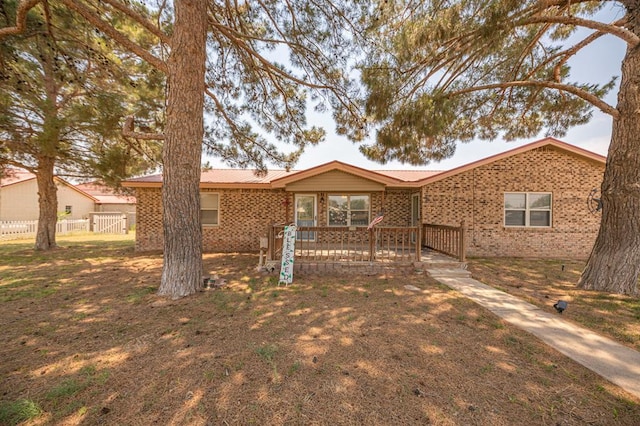
#50084058, Tracy Farrow, Listing office: Tracy Farrow Realty
#50084054, Jordan Linnenkugel, Listing office: Keller Williams Realty Lubbock
#50084037, Sarah Ivey, Listing office: Century 21 The Edge - Midland

#161887, Paula Phillips, Listing office: D.E. The Home Boss Group LLC
#50083985, Rhonda Cooper, Listing office: Berkshire Hathaway HomeServices Cooper Realty
#161849, Ana Montoya, Listing office: The Real Estate Ranch LLC
#50083958, Kerri Payne, Listing office: The Agency Kerri Payne James Real Estate Team
#50083950, Ramon Gomez, Listing office: Keller Williams Realty
#161798, Thomas Johnston, Listing office: The Real Estate Ranch LLC
#161774, Ana Montoya, Listing office: The Real Estate Ranch LLC

#161773, Jackelyn Bedoy, Listing office: All City Real Estate Ltd. Co.
#50083881, RISE Real Estate Group at Fathom Realty, Listing office: Fathom Realty
Nearby markets aren't available for Midland South, TX
Based on information from Permian Basin MLS, Odessa MLS, and North Texas Real Estate Information Systems Inc. for the period 07/01/2023 - 07/01/2025
 ©2025 North Texas Real Estate Information Systems. All rights reserved. The database information herein is provided from and copyrighted by the North Texas Real Estate Information Systems, Inc. NTREIS data may not be reproduced or redistributed and is only for people viewing this site. All information provided is deemed reliable but is not guaranteed and should be independently verified. The advertisements herein are merely indications to bid and are not offers to sell which may be accepted. All properties are subject to prior sale or withdrawal. All rights are reserved by copyright.