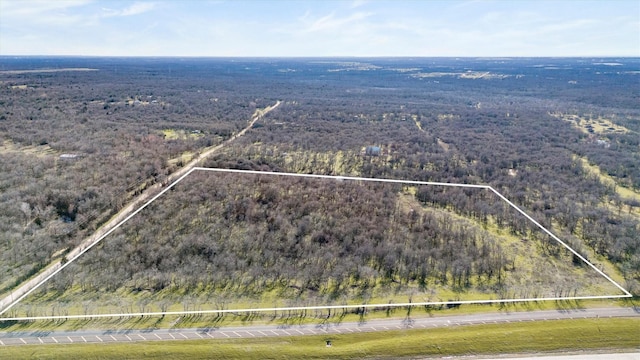
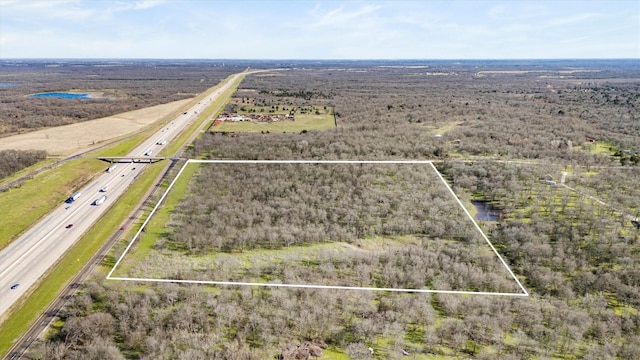
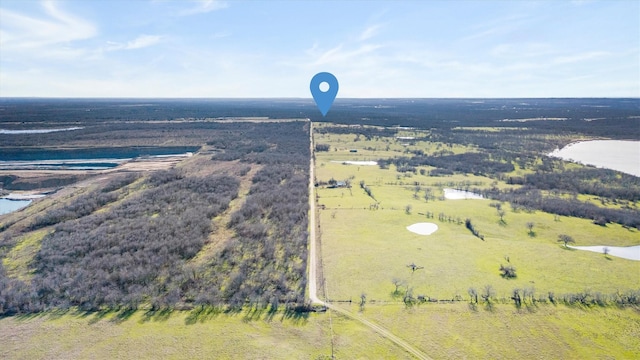
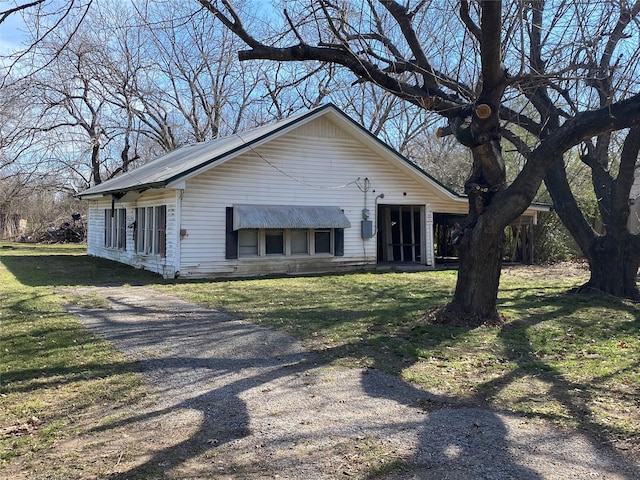
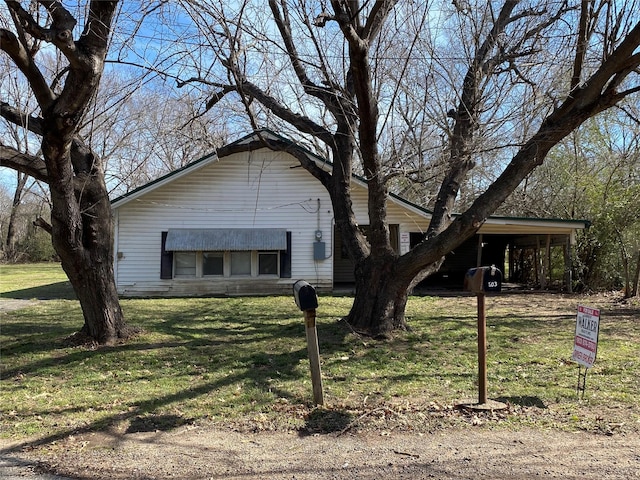
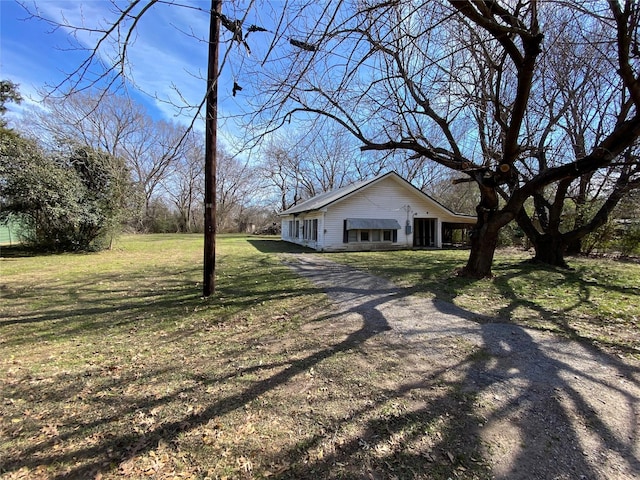
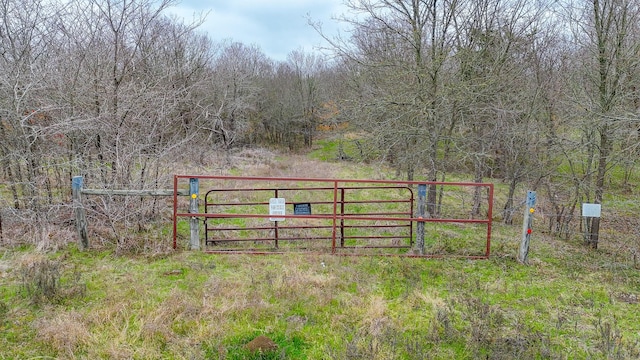
New - 5 days on RocketVideo tour

#20854609, Dimitria King, Listing Office: Sage Street Realty


How much do homes in Richland, TX cost?
Based on all homes listed in February 2025
The list price of homes in Richland has increased by 195.5% since January.
Summary: The median home list price in Richland was $147,450 in February 2025, up 195.5% from the previous month, and the median price per square foot was $86.
| Beds | Jan 2025 | Feb 2025 | Change MoM |
|---|---|---|---|
| 11 Bedroom | - | - | N/A |
| 22 Bedrooms | $49.9K | $49.9K | 0.0% |
| 33 Bedrooms | - | - | N/A |
| 44 Bedrooms | - | $245K | N/A |
| 55+ Bedrooms | - | - | N/A |
Summary: Richland housing price by bedroom type for February 2025, compared to the previous month. The home price for 1 bedroom homes did not change. The home price for 2 bedroom homes did not change. The home price for 3 bedroom homes did not change. The home price for 4 bedroom homes did not change. The home price for 5 bedroom homes did not change.
How many homes are available in Richland, TX?
| Last Month | 2 months ago | Change MoM |
|---|---|---|
| 2Last MonthFeb 2025 | ||
| 12 months agoJan 2025 | +100.0 % Change MoMJan – Feb |
Summary: The Richland real estate market had 2 homes for sale in Feb 2025, a 100.0 % increase compared to Jan 2025.
| Beds | Jan 2025 | Feb 2025 | Change MoM |
|---|---|---|---|
| 11 Bedroom | 0 | 0 | 0.0% |
| 22 Bedrooms | 1 | 1 | 0.0% |
| 33 Bedrooms | 0 | 0 | 0.0% |
| 44 Bedrooms | 0 | 1 | +100.0% |
| 55+ Bedrooms | 0 | 0 | 0.0% |
Summary: Richland housing inventory by bedroom type for February 2025, compared to the previous month. The inventory for 1 bedroom homes remained the same. The inventory for 2 bedroom homes remained the same. The inventory for 3 bedroom homes remained the same. The inventory for 4 bedroom homes increased by +100.0%. The inventory for 5 bedroom homes remained the same.
How long does it take to sell a home in Richland, TX?
| Last Month | 1 month ago | Change MoM |
|---|---|---|
| 23 DaysLast MonthFeb 2025 | ||
| 10 Days1 month agoJan 2025 | +130.0 % Change MoMJan – Feb |
Summary: Homes in Richland had an average listing age of 23 days in Feb 2025, up by 130.0% compared to the previous month.
Connect With An Agent
Local real estate agents are ready to help you find a home here
Sell My Home
Sell your home with an expert or get the job done on your own.
Get Approved
Get a customizable mortgage solution based on today's rates.
What homes are available in Richland, TX?
#20854609, Dimitria King, Listing Office: Sage Street Realty


#20850737, Jeremy Betz, Listing Office: Exit Realty Pro
#20824403, Denna Green, Listing Office: Earnest Walker Realty, Inc.
#20797760, Gannan Stewart, Tammy Carter, Listing Office: Ebby Halliday Realtors
Nearby markets aren't available for Richland, TX
Based on information from North Texas Real Estate Information Systems Inc., for the period 01/01/2025 - 03/01/2025
 ©2025 North Texas Real Estate Information Systems. All rights reserved. The database information herein is provided from and copyrighted by the North Texas Real Estate Information Systems, Inc. NTREIS data may not be reproduced or redistributed and is only for people viewing this site. All information provided is deemed reliable but is not guaranteed and should be independently verified. The advertisements herein are merely indications to bid and are not offers to sell which may be accepted. All properties are subject to prior sale or withdrawal. All rights are reserved by copyright.