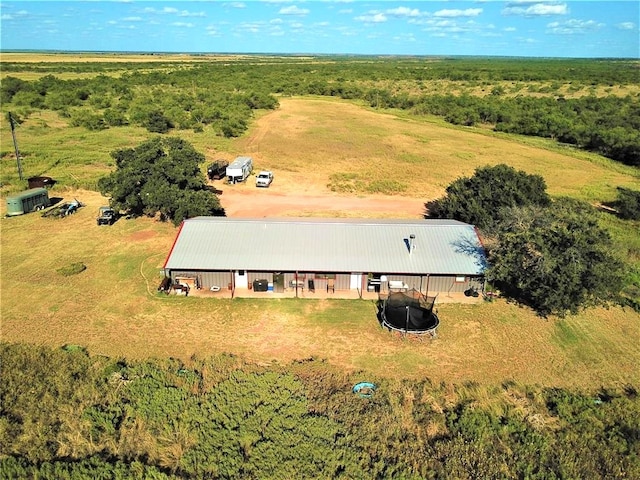
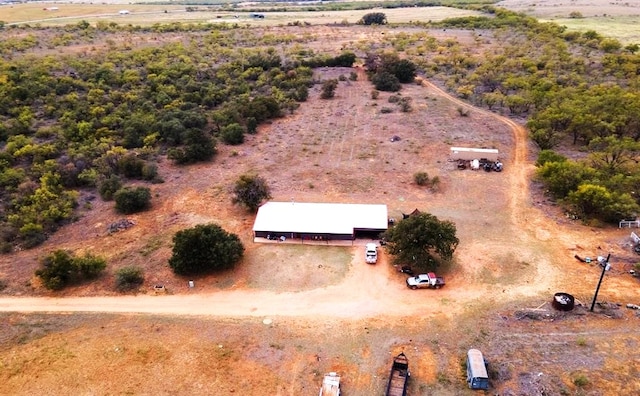
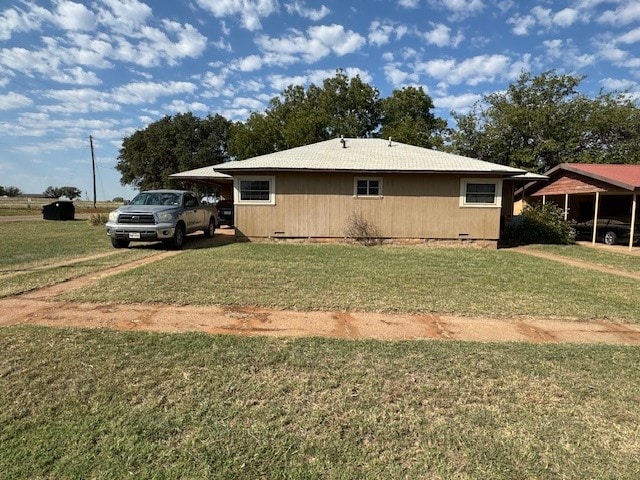
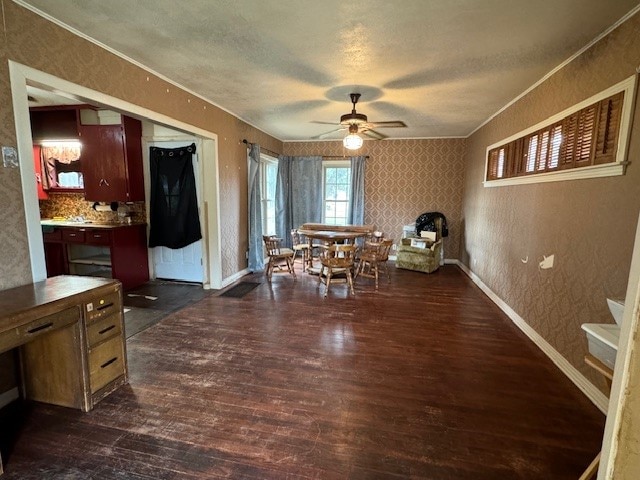
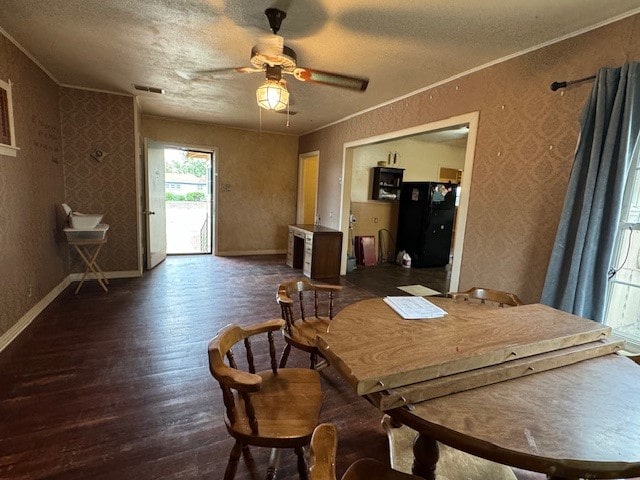
Video tour
$1,009 Closing Credit¹

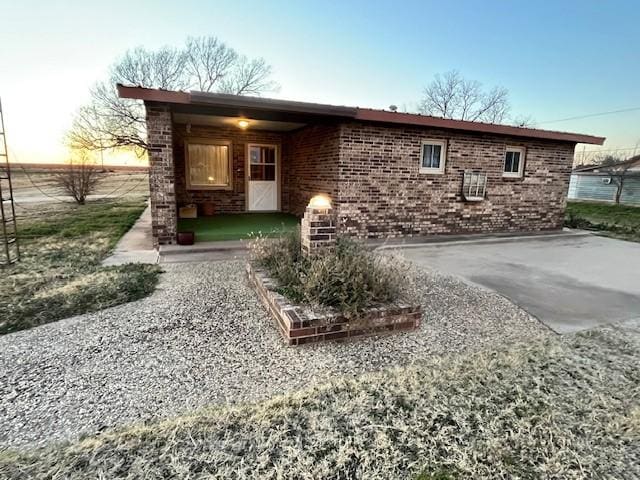
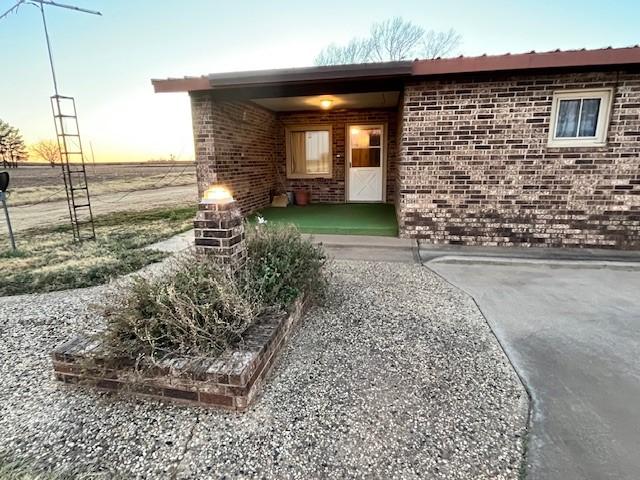
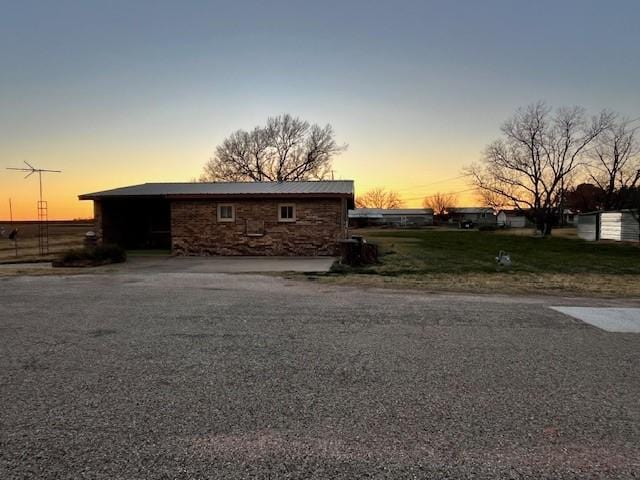
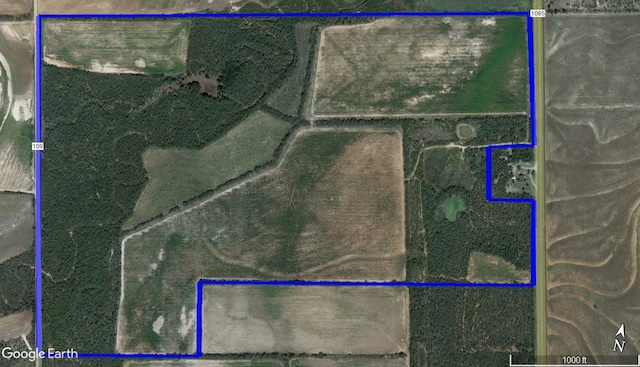
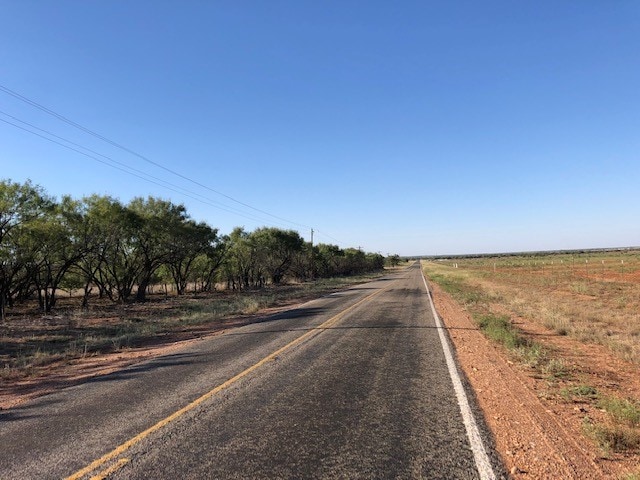
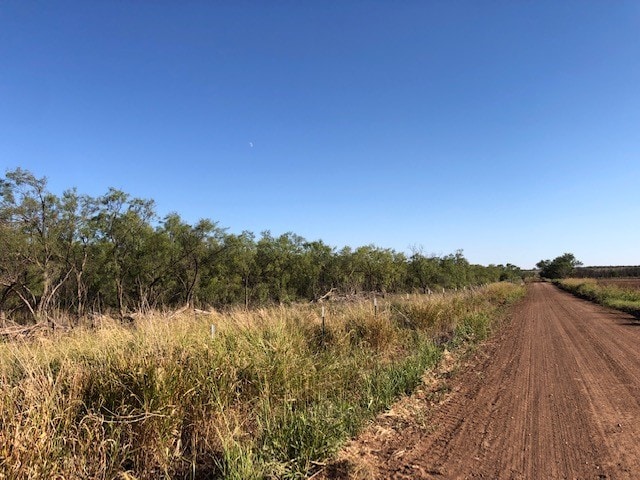
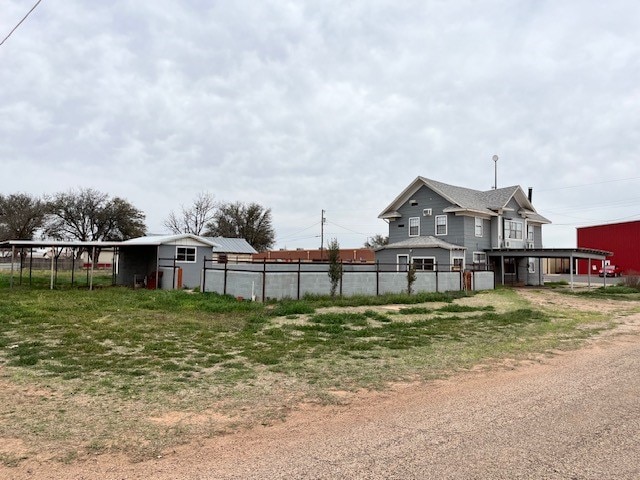
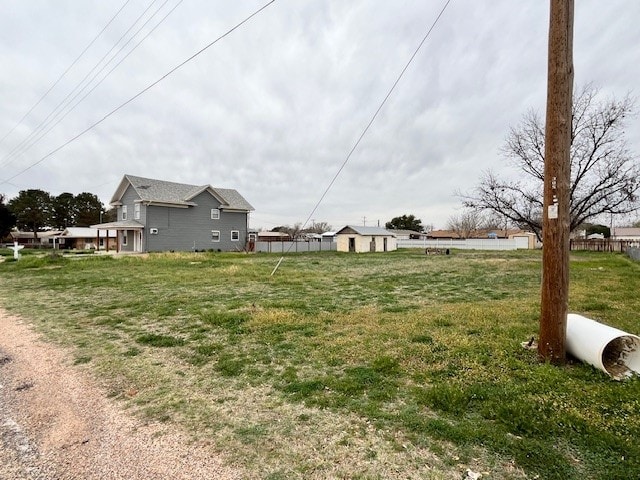
#20816351, Jeffrey Branson, Listing Office: Williamson-Branson Real Estate


How much do homes in Roby, TX cost?
Based on all homes listed in the last 12 months
The list price of homes in Roby has decreased by 35.7% since last year.
Summary: The median home list price in Roby was $85,000 in January 2025, down 35.7% from the previous year, and the median price per square foot was $58.
| Beds | Jan 2024 | Jan 2025 | Change YoY |
|---|---|---|---|
| 11 Bedroom | - | - | N/A |
| 22 Bedrooms | $175K | $62K | -64.6% |
| 33 Bedrooms | $84.7K | $85K | 0.3% |
| 44 Bedrooms | $198K | $590K | +198.0% |
| 55+ Bedrooms | - | - | N/A |
Summary: Roby housing price by bedroom type for January 2025, compared to the previous year. The home price for 1 bedroom homes did not change. The home price for 2 bedroom homes decreased by -64.6%. The home price for 3 bedroom homes increased by 0.3%. The home price for 4 bedroom homes increased by +198.0%. The home price for 5 bedroom homes did not change.
How many homes are available in Roby, TX?
| Last Month | 2 months ago | Change MoM |
|---|---|---|
| 4Last MonthJan 2025 | ||
| 42 months agoDec 2024 | 0.0 % Change MoMDec – Jan |
Summary: The Roby real estate market had 4 homes for sale in Jan 2025, the same as Dec 2024
| Beds | Dec 2024 | Jan 2025 | Change MoM |
|---|---|---|---|
| 11 Bedroom | 0 | 0 | 0.0% |
| 22 Bedrooms | 0 | 0 | 0.0% |
| 33 Bedrooms | 3 | 3 | 0.0% |
| 44 Bedrooms | 1 | 1 | 0.0% |
| 55+ Bedrooms | 0 | 0 | 0.0% |
Summary: Roby housing inventory by bedroom type for January 2025, compared to the previous month. The inventory for 1 bedroom homes remained the same. The inventory for 2 bedroom homes remained the same. The inventory for 3 bedroom homes remained the same. The inventory for 4 bedroom homes remained the same. The inventory for 5 bedroom homes remained the same.
How long does it take to sell a home in Roby, TX?
| This Year | 1 year ago | Change YoY |
|---|---|---|
| 143 DaysThis YearJan 2025 | ||
| 259 Days1 year agoJan 2024 | -44.8 % Change YoYJan 2024 – Jan 2025 |
Summary: Homes in Roby had an average listing age of 143 days in Jan 2025, down by 44.8% compared to the previous year.
Connect With An Agent
Local real estate agents are ready to help you find a home here
Sell My Home
Sell your home with an expert or get the job done on your own.
Get Approved
Get a customizable mortgage solution based on today's rates.
What homes are available in Roby, TX?
#20816351, Jeffrey Branson, Listing Office: Williamson-Branson Real Estate
#20767258, Debra Holland, Listing Office: TX Lake & Land Real Estate
#20753868, Caitlin Williamson, Listing Office: Williamson-Branson Real Estate
#20721319, Stephen Reid, Listing Office: Trinity Ranch Land Cross Plains
#20709929, Jeffrey Branson, Listing Office: Williamson-Branson Real Estate
#20546801, Jeffrey Branson, Listing Office: Williamson-Branson Real Estate
Nearby markets aren't available for Roby, TX
Based on information from North Texas Real Estate Information Systems Inc., for the period 02/01/2023 - 02/01/2025
 ©2025 North Texas Real Estate Information Systems. All rights reserved. The database information herein is provided from and copyrighted by the North Texas Real Estate Information Systems, Inc. NTREIS data may not be reproduced or redistributed and is only for people viewing this site. All information provided is deemed reliable but is not guaranteed and should be independently verified. The advertisements herein are merely indications to bid and are not offers to sell which may be accepted. All properties are subject to prior sale or withdrawal. All rights are reserved by copyright.