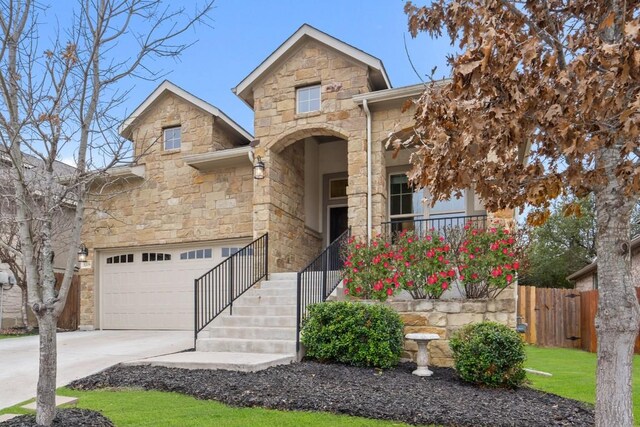
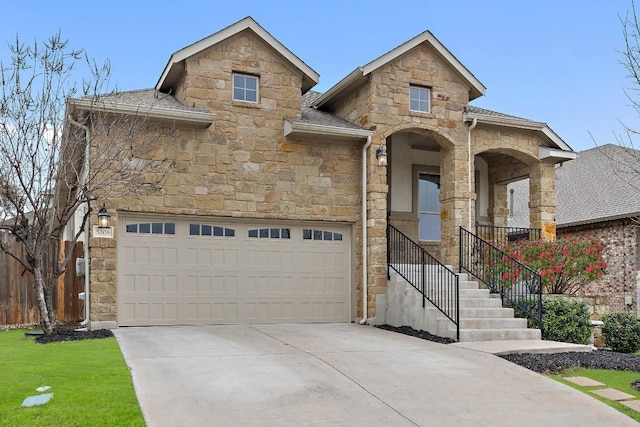
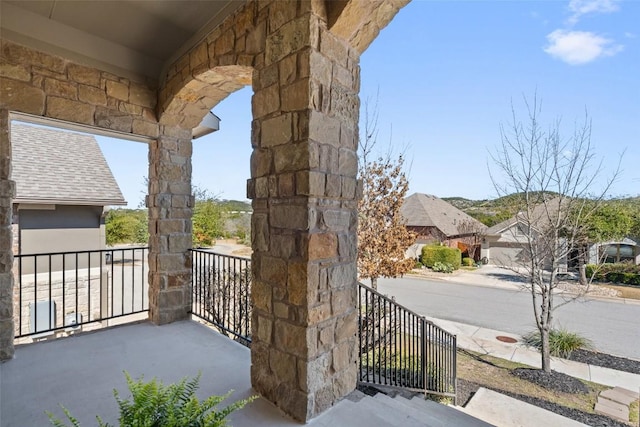
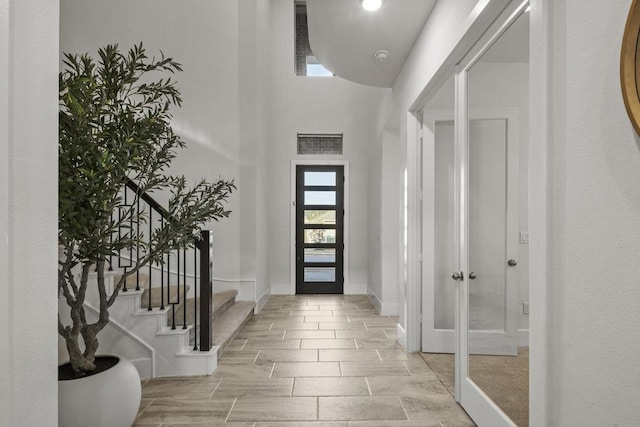
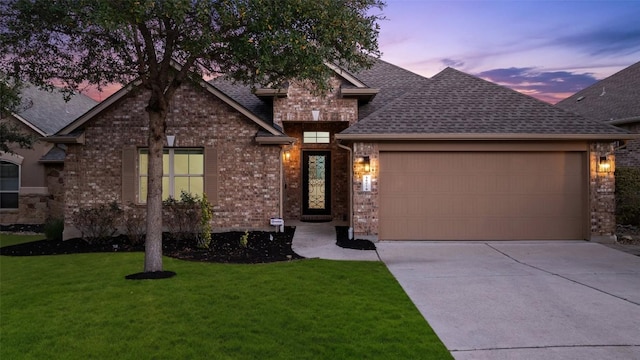
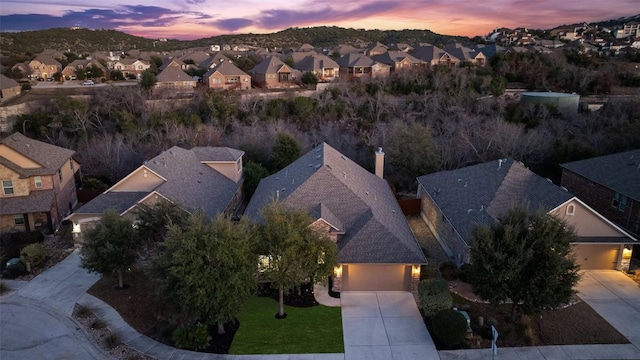
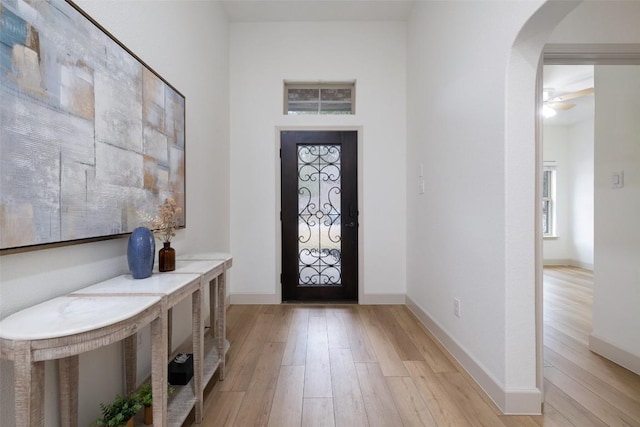
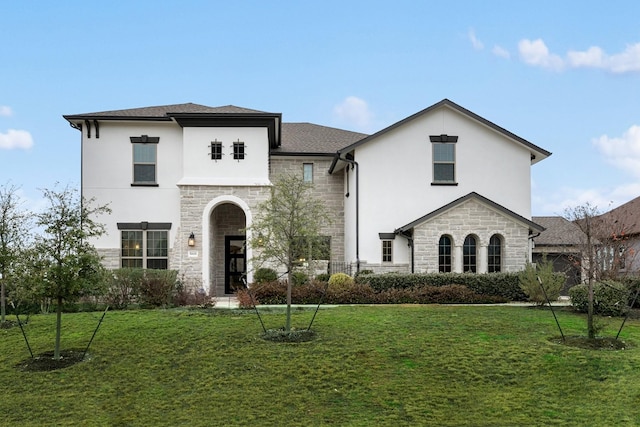
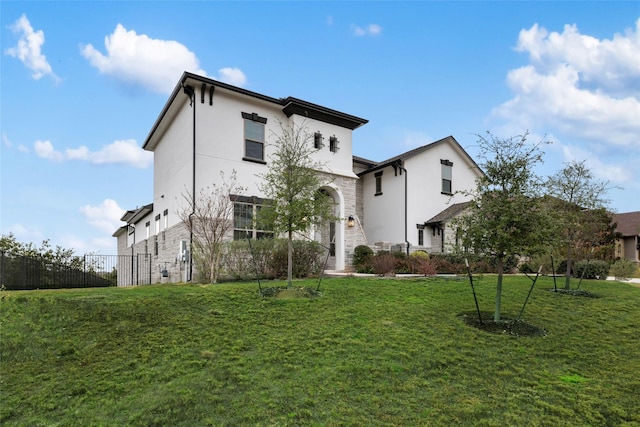
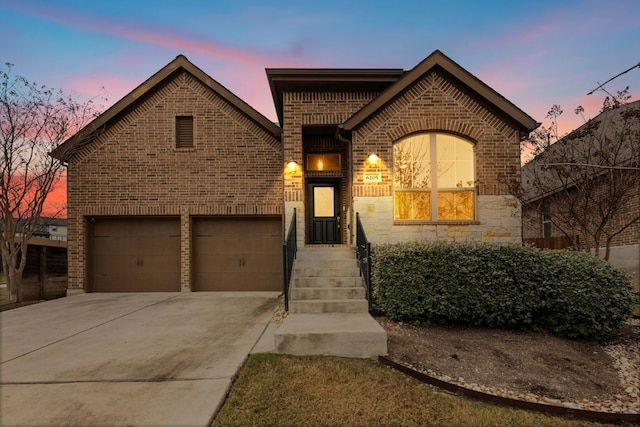
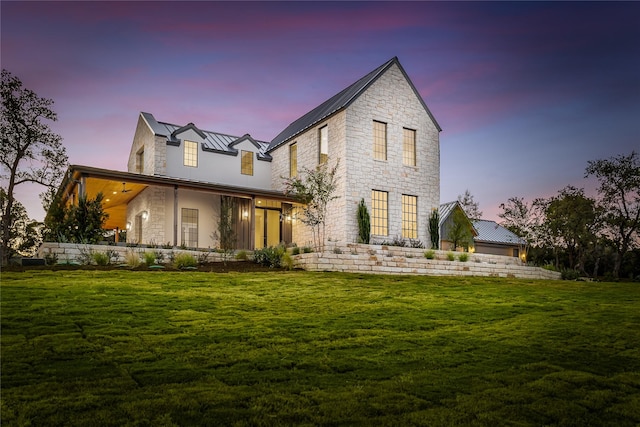
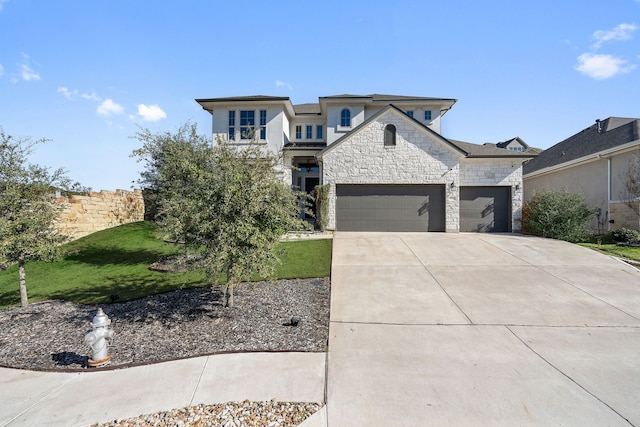
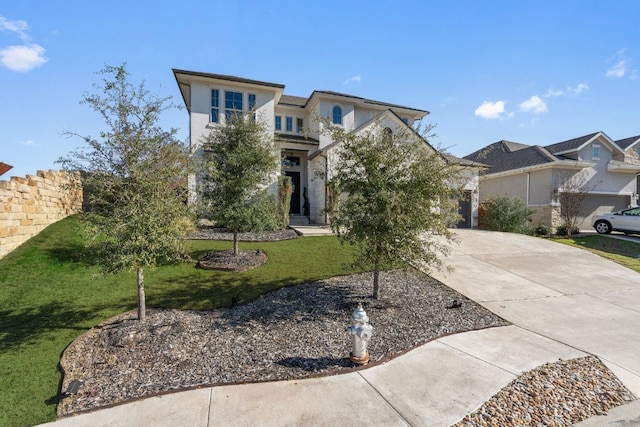
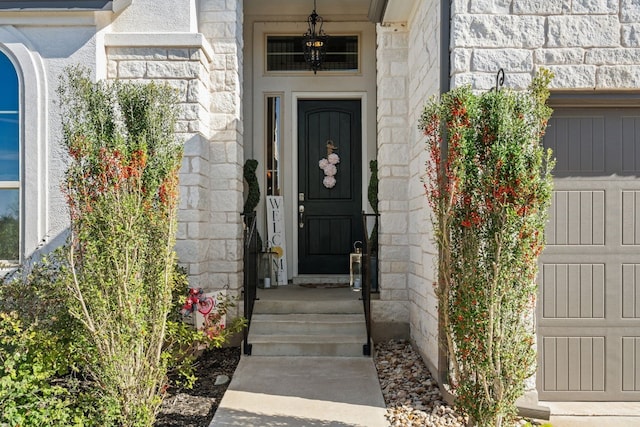
New - 2 days on Rocket
$6,709 Closing Credit¹
#1366987, Michael Scheffe, Listing Office: Keller Williams Realty


How much do homes in Sweetwater, TX cost?
Is Sweetwater, TX a buyer’s or seller’s market?
Seller'sMarket
Buyer'sMarket
Sweetwater is a Seller's Market
Difference Since February 2024
At the same time last year, Sweetwater was a Buyer's Market.
Sweetwater is a Sellers Housing Market, which means prices tend to be higher and homes sell faster.
Based on all homes sold in the last 12 months
Homes in Sweetwater have sold for 1.6% more than they did a year ago.
Summary: The median home sold price in Sweetwater was $711,536 in February 2025, up 1.6% from last year, and the median price per square foot was $260.
| City | Feb 2024 | Feb 2025 | Change YoY |
|---|---|---|---|
| Serene Hills | $1.3M | $1.4M | +11.2% |
| Sweetwater | $700K | $711.5K | +1.6% |
| South Lake Travis | $827K | $825K | -0.3% |
| Beds | Feb 2024 | Feb 2025 | Change YoY |
|---|---|---|---|
| 11 Bedroom | - | - | N/A |
| 22 Bedrooms | - | - | N/A |
| 33 Bedrooms | $584.5K | $550K | -5.9% |
| 44 Bedrooms | $725K | $727.5K | 0.3% |
| 55+ Bedrooms | $1.2M | $949.7K | -25.9% |
Summary: Sweetwater housing price by bedroom type for February 2025, compared to the previous year. The home price for 1 bedroom homes did not change. The home price for 2 bedroom homes did not change. The home price for 3 bedroom homes decreased by -5.9%. The home price for 4 bedroom homes increased by 0.3%. The home price for 5 bedroom homes decreased by -25.9%.
How many homes are available in Sweetwater, TX?
| Last Month | 2 months ago | Change MoM |
|---|---|---|
| 40Last MonthFeb 2025 | ||
| 382 months agoJan 2025 | +5.3 % Change MoMJan – Feb |
Summary: The Sweetwater real estate market had 40 homes for sale in Feb 2025, a 5.3 % increase compared to Jan 2025.
| Last Month | 2 months ago | Change MoM |
|---|---|---|
| 7Last MonthFeb 2025 | ||
| 52 months agoJan 2025 | +40.0 % Change MoMJan – Feb |
| Beds | Jan 2025 | Feb 2025 | Change MoM |
|---|---|---|---|
| 11 Bedroom | 0 | 0 | 0.0% |
| 22 Bedrooms | 0 | 0 | 0.0% |
| 33 Bedrooms | 13 | 15 | +15.4% |
| 44 Bedrooms | 20 | 20 | 0.0% |
| 55+ Bedrooms | 5 | 5 | 0.0% |
Summary: Sweetwater housing inventory by bedroom type for February 2025, compared to the previous month. The inventory for 1 bedroom homes remained the same. The inventory for 2 bedroom homes remained the same. The inventory for 3 bedroom homes increased by +15.4%. The inventory for 4 bedroom homes remained the same. The inventory for 5 bedroom homes remained the same.
How much do homes in Sweetwater, TX cost?
Over Asking Price1 Home
At Asking Price1 Home
Under Asking Price5 Homes
If you're buying a home in Sweetwater, you may be able to get a good deal. 71.4% of homes here sold below asking price last month.
Summary: A total of 7 homes were sold or pending in Sweetwater in February 2025, up by 40.0% month-over-month. Of the 7 sold homes, 71% were sold under asking, 14% were sold at asking, and and 14% were sold over asking.
How long does it take to sell a home in Sweetwater, TX?
Under 30 Days4 Homes
30 – 90 Days1 Home
Over 90 Days2 Homes
Many homes in Sweetwater are selling fast, if you're buying plan to act quickly.
Summary: During February 2025, 7 homes were sold in Sweetwater; 57% of homes were sold within 30 days, 14% of homes were sold within 30 to 90 days, and 29% of homes were sold over 90 days.
| This Year | 1 year ago | Change YoY |
|---|---|---|
| 82 DaysThis YearFeb 2025 | ||
| 114 Days1 year agoFeb 2024 | -27.6 % Change YoYFeb 2024 – Feb 2025 |
Summary: Homes in Sweetwater had an average listing age of 82 days in Feb 2025, down by 27.6% compared to the previous year.
Connect With An Agent
Local real estate agents are ready to help you find a home here
Sell My Home
Sell your home with an expert or get the job done on your own.
Get Approved
Get a customizable mortgage solution based on today's rates.
What homes are available in Sweetwater, TX?
#1366987, Michael Scheffe, Listing Office: Keller Williams Realty
#3278378, Dana Leslie, Listing Office: Kuper Sotheby's Int'l Realty


#5856545, Jared English, Listing Office: Congress Realty, Inc.

#2769616, Matt Menard, Listing Office: ERA Experts
#9569281, Charla Housson, Listing Office: Compass RE Texas, LLC
#9897326, Gwen Young, Listing Office: Compass RE Texas, LLC

#2940760, Susan Reames, Listing Office: Coldwell Banker Realty
#9188482, Susana Elosegui, Listing Office: Keller Williams - Lake Travis

#3742756, Dara Allen, Listing Office: @ properties Christie's International
#3500100, Susan Reames, Listing Office: Coldwell Banker Realty
#7497251, Matt Menard, Listing Office: ERA Experts
#7252514, Alison Elliott, Listing Office: Kuper Sotheby's Int'l Realty
Based on information from Unlock MLS, for the period 03/01/2023 - 03/01/2025
 Based on information from the Austin Board of REALTORS® (alternatively, from ACTRIS or Unlock MLS®). All information provided is deemed reliable but is not guaranteed and should be independently verified. The Austin Board of REALTORS®, ACTRIS, Unlock MLS and their affiliates provide the MLS and all content therein “AS IS” and without any warranty, express or implied. The information included in this listing is provided exclusively for consumers’ personal, non-commercial use and may not be used for any purpose other than to identify prospective properties consumers may be interested in purchasing. Data maintained by the Board, ACTRIS or Unlock MLS may not reflect all real estate activity in the market. Prices displayed on all Sold listings are the Last Known Listing Price and may not be the actual selling price.
  Listings courtesy of Unlock MLS as distributed by MLS GRID.