4 hours on Rocket

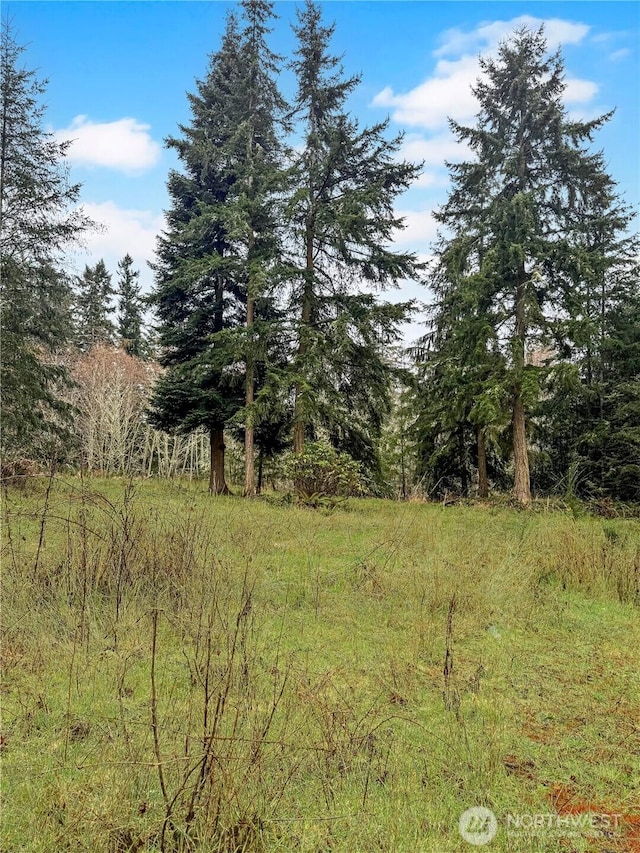
#2412503, Kevin M. Miller, Listing office: Ideal Real Estate


How much do homes in Oak Bay-Port Ludlow, WA cost?
Is Oak Bay-Port Ludlow, WA a buyer’s or seller’s market?
Seller'sMarket
Buyer'sMarket
Oak Bay-Port Ludlow is a Buyer's Market
Difference Since June 2024
At the same time last year, Oak Bay-Port Ludlow was a Neutral Market.
Oak Bay-Port Ludlow is a Buyers Housing Market, which means prices tend to be lower and homes stay on the market longer.
Based on all homes sold in the last 12 months
The sold price of homes in Oak Bay-Port Ludlow has remained the same since last year.
Summary: The median home sold price in Oak Bay-Port Ludlow was $620,000 in June 2025, the same as last year, and the median price per square foot was $325.
| City | Jun 2024 | Jun 2025 | Change YoY |
|---|---|---|---|
| Chimacum | $580.5K | $686.5K | +18.3% |
| Oak Bay-Port Ludlow | $620K | $620K | 0.0% |
| Discovery Bay-Port Townsend | $675K | $665K | -1.5% |
| Beds | Jun 2024 | Jun 2025 | Change YoY |
|---|---|---|---|
| 11 Bedroom | $1.0M | $690K | -36.1% |
| 22 Bedrooms | $599.5K | $612.5K | +2.2% |
| 33 Bedrooms | $636.5K | $639K | 0.4% |
| 44 Bedrooms | $700K | $594.7K | -15.0% |
| 55+ Bedrooms | $600K | $761.2K | +26.9% |
Summary: Oak Bay-Port Ludlow housing price by bedroom type for June 2025, compared to the previous year. The home price for 1 bedroom homes decreased by -36.1%. The home price for 2 bedroom homes increased by +2.2%. The home price for 3 bedroom homes increased by 0.4%. The home price for 4 bedroom homes decreased by -15.0%. The home price for 5 bedroom homes increased by +26.9%.
Market comparison tool
Data and numbers shown are subject to change and may vary based on different timeframes.
Oak Bay-Port Ludlow, WA
How many homes are available in Oak Bay-Port Ludlow, WA?
| Last Month | 2 months ago | Change MoM |
|---|---|---|
| 96Last MonthJun 2025 | ||
| 812 months agoMay 2025 | +18.5 % Change MoMMay – Jun |
Summary: The Oak Bay-Port Ludlow real estate market had 96 homes for sale in Jun 2025, a 18.5 % increase compared to May 2025.
| Last Month | 2 months ago | Change MoM |
|---|---|---|
| 8Last MonthJun 2025 | ||
| 122 months agoMay 2025 | -33.3 % Change MoMMay – Jun |
| Beds | May 2025 | Jun 2025 | Change MoM |
|---|---|---|---|
| 11 Bedroom | 4 | 5 | +25.0% |
| 22 Bedrooms | 35 | 36 | +2.9% |
| 33 Bedrooms | 32 | 45 | +40.6% |
| 44 Bedrooms | 9 | 9 | 0.0% |
| 55+ Bedrooms | 1 | 1 | 0.0% |
Summary: Oak Bay-Port Ludlow housing inventory by bedroom type for June 2025, compared to the previous month. The inventory for 1 bedroom homes increased by +25.0%. The inventory for 2 bedroom homes increased by +2.9%. The inventory for 3 bedroom homes increased by +40.6%. The inventory for 4 bedroom homes remained the same. The inventory for 5 bedroom homes remained the same.
How much do homes in Oak Bay-Port Ludlow, WA cost?
Over Asking Price1 Home
At Asking Price0 Home
Under Asking Price7 Homes
If you're buying a home in Oak Bay-Port Ludlow, you may be able to get a good deal. 87.5% of homes here sold below asking price last month.
Summary: A total of 8 homes were sold or pending in Oak Bay-Port Ludlow in June 2025, down by 33.3% month-over-month. Of the 8 sold homes, 88% were sold under asking, 0% were sold at asking, and and 13% were sold over asking.
How long does it take to sell a home in Oak Bay-Port Ludlow, WA?
Under 30 Days7 Homes
30 – 90 Days1 Home
Over 90 Days0 Home
Many homes in Oak Bay-Port Ludlow are selling fast, if you're buying plan to act quickly.
Summary: During June 2025, 8 homes were sold in Oak Bay-Port Ludlow; 88% of homes were sold within 30 days, 13% of homes were sold within 30 to 90 days, and 0% of homes were sold over 90 days.
| This Year | 1 year ago | Change YoY |
|---|---|---|
| 14 DaysThis YearJun 2025 | ||
| 72 Days1 year agoJun 2024 | -80.6 % Change YoYJun 2024 – Jun 2025 |
Summary: Homes in Oak Bay-Port Ludlow had an average listing age of 14 days in Jun 2025, down by 80.6% compared to the previous year.
Connect With An Agent
Local real estate agents are ready to help you find a home here
Sell My Home
Sell your home with an expert or get the job done on your own.
Get Approved
Get a customizable mortgage solution based on today's rates.
What homes are available in Oak Bay-Port Ludlow, WA?
#2412503, Kevin M. Miller, Listing office: Ideal Real Estate
#2413155, Abbie Little, Listing office: Bell Tower Brokers
#2413126, Terry McHugh, Listing office: RE/MAX FIRST Inc Port Townsend
#2409965, Bridget Young, Listing office: Windermere RE West Sound Inc.
#2412351, Chelsea Guelcher, Listing office: Manette Real Estate Co.
#2411531, Rebecca Gore-Clark, Listing office: Windermere RE West Sound Inc.
#2411154, Rebecca Gore-Clark, Listing office: Windermere RE West Sound Inc.
#2411148, Rebecca Gore-Clark, Listing office: Windermere RE West Sound Inc.
#2411150, Rebecca Gore-Clark, Listing office: Windermere RE West Sound Inc.
#2407963, Carol Glad, Listing office: John L. Scott, Inc.
#2410763, Kristen Johnson, Listing office: eXp Realty
#2409584, Nicole Blasucci, Listing office: Coldwell Banker Best Homes
Based on information from Northwest Multiple Listing Service, for the period 07/01/2023 - 07/01/2025
 Listings courtesy of Northwest Multiple Listing Service as distributed by MLS GRID.
 The data relating to real estate for sale on this website comes in part from the Internet Data Exchange program of Northwest Multiple Listing Service IDX. Real estate listings held by other brokerage firms are marked with the green "three trees" logo and includes the name of the listing broker(s). Copyright © 2025 Northwest MLS. All rights reserved.