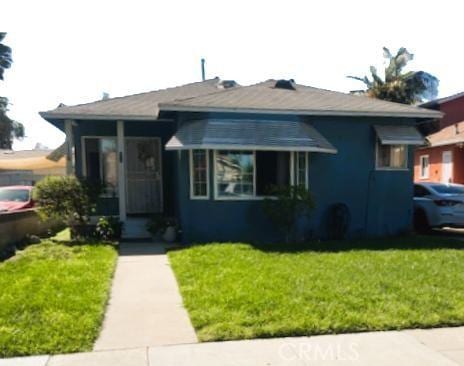
1 day on Rocket

#DW25162563, Guadalupe Mejia, Listing office: Excellence RE Real Estate


How much do homes in South Gate, CA cost?
Based on all homes listed in the last 12 months
The list price of homes in South Gate has increased by 6.3% since last year.
Summary: The median home list price in South Gate was $690,000 in June 2025, up 6.3% from the previous year, and the median price per square foot was $553.
| City | Jun 2024 | Jun 2025 | Change YoY |
|---|---|---|---|
| Lynwood | $649.5K | $699K | +7.6% |
| South Gate | $649K | $690K | +6.3% |
| South Gate-East Los Angeles | $635K | $669.9K | +5.5% |
| Bell Gardens | $638.5K | $648.5K | +1.6% |
| Beds | Jun 2024 | Jun 2025 | Change YoY |
|---|---|---|---|
| 11 Bedroom | - | - | N/A |
| 22 Bedrooms | $599.9K | $632.5K | +5.4% |
| 33 Bedrooms | $650K | $699K | +7.5% |
| 44 Bedrooms | $712.4K | $781.5K | +9.7% |
| 55+ Bedrooms | $1.1M | $1.1M | -4.7% |
Summary: South Gate housing price by bedroom type for June 2025, compared to the previous year. The home price for 1 bedroom homes did not change. The home price for 2 bedroom homes increased by +5.4%. The home price for 3 bedroom homes increased by +7.5%. The home price for 4 bedroom homes increased by +9.7%. The home price for 5 bedroom homes decreased by -4.7%.
Market comparison tool
Data and numbers shown are subject to change and may vary based on different timeframes.
South Gate, CA
How many homes are available in South Gate, CA?
| Last Month | 2 months ago | Change MoM |
|---|---|---|
| 46Last MonthJun 2025 | ||
| 522 months agoMay 2025 | -11.5 % Change MoMMay – Jun |
Summary: The South Gate real estate market had 46 homes for sale in Jun 2025, a 11.5 % decrease compared to May 2025.
| Beds | May 2025 | Jun 2025 | Change MoM |
|---|---|---|---|
| 11 Bedroom | 0 | 0 | 0.0% |
| 22 Bedrooms | 20 | 18 | -10.0% |
| 33 Bedrooms | 24 | 20 | -16.7% |
| 44 Bedrooms | 6 | 6 | 0.0% |
| 55+ Bedrooms | 2 | 2 | 0.0% |
Summary: South Gate housing inventory by bedroom type for June 2025, compared to the previous month. The inventory for 1 bedroom homes remained the same. The inventory for 2 bedroom homes decreased by -10.0%. The inventory for 3 bedroom homes decreased by -16.7%. The inventory for 4 bedroom homes remained the same. The inventory for 5 bedroom homes remained the same.
How much do homes in South Gate, CA cost?
Over Asking Price5 Homes
At Asking Price1 Home
Under Asking Price2 Homes
If you're buying a home in South Gate, you could pay more than the asking price. 62.5% of homes here sold above asking price last month.
Summary: A total of 8 homes were sold or pending in South Gate in June 2025, down by 11.1% month-over-month. Of the 8 sold homes, 25% were sold under asking, 13% were sold at asking, and and 63% were sold over asking.
How long does it take to sell a home in South Gate, CA?
Under 30 Days6 Homes
30 – 90 Days2 Homes
Over 90 Days0 Home
Many homes in South Gate are selling fast, if you're buying plan to act quickly.
Summary: During June 2025, 8 homes were sold in South Gate; 75% of homes were sold within 30 days, 25% of homes were sold within 30 to 90 days, and 0% of homes were sold over 90 days.
| This Year | 1 year ago | Change YoY |
|---|---|---|
| 69 DaysThis YearJun 2025 | ||
| 103 Days1 year agoJun 2024 | -33.3 % Change YoYJun 2024 – Jun 2025 |
Summary: Homes in South Gate had an average listing age of 69 days in Jun 2025, down by 33.3% compared to the previous year.
Connect With An Agent
Local real estate agents are ready to help you find a home here
Sell My Home
Sell your home with an expert or get the job done on your own.
Get Approved
Get a customizable mortgage solution based on today's rates.
What homes are available in South Gate, CA?
#DW25162563, Guadalupe Mejia, Listing office: Excellence RE Real Estate
#PW25162902, Maria Cotaya, Listing office: Sunrise Realty & Home Loans In
#DW25161480, Lorena Arreola, Listing office: SoCal 5 Real Estate
#DW25161097, Greta Zapien, Listing office: Keller Williams SELA
#SR25158725, Cesar Galvan-Cervantes, Listing office: JohnHart Real Estate
#SR25153774, Lori Dekermenjian, Listing office: JohnHart Real Estate
#SR25158162, Jorge Padron, Listing office: Real Brokerage Technologies, Inc.
#DW25158293, Rosio Castaneda, Listing office: First Class Platinum Brokers
#RS25157983, Francisco Granadeno, Listing office: Big Block Powerhouse Realty
#DW25157259, Adriana Bernal, Listing office: Real Estate Xperts
#SR25156675, Francisco Pulupa, Listing office: Homesmart Evergreen Realty
#CV25151217, Manlio Ceja-Gomez, Listing office: KELLER WILLIAMS REALTY
Based on information from California Regional MLS, for the period 07/01/2023 - 07/01/2025
 Based on information from California Regional Multiple Listing Service, Inc. and /or other sources. All data, including all measurements and calculations of area, is obtained from various sources and has not been, and will not be, verified by broker or MLS. All information should be independently reviewed and verified for accuracy. The data contained herein is copyrighted by CRMLS and is protected by all applicable copyright laws. Any dissemination of this information is in violation of copyright laws and is strictly prohibited.