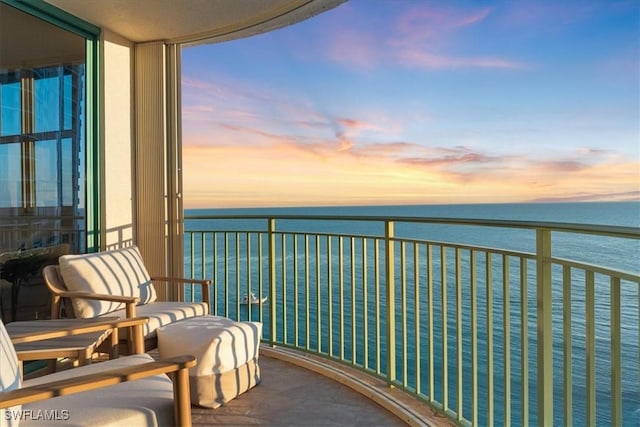

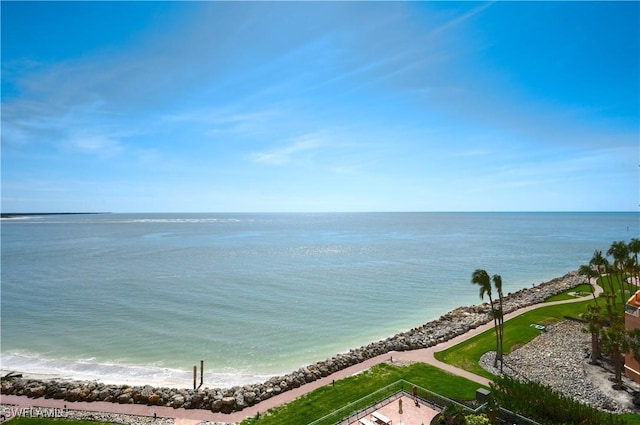
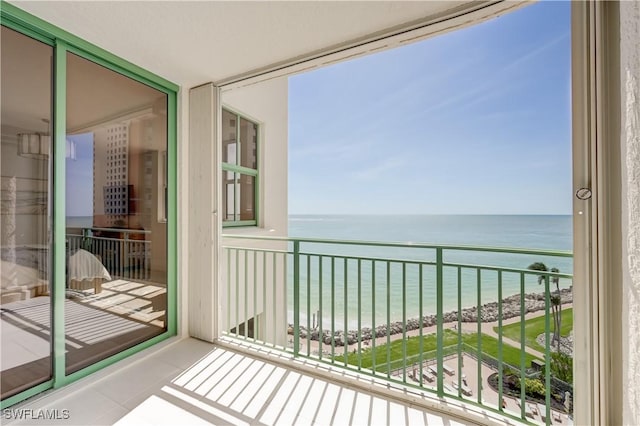
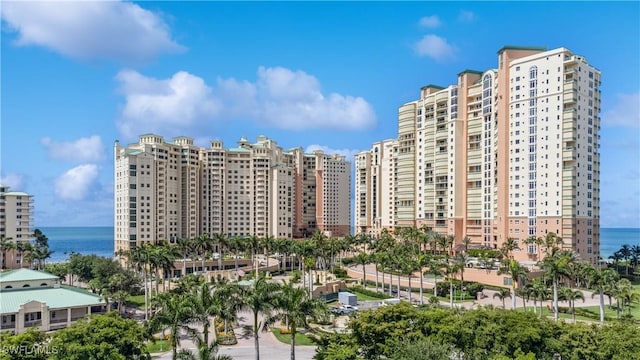
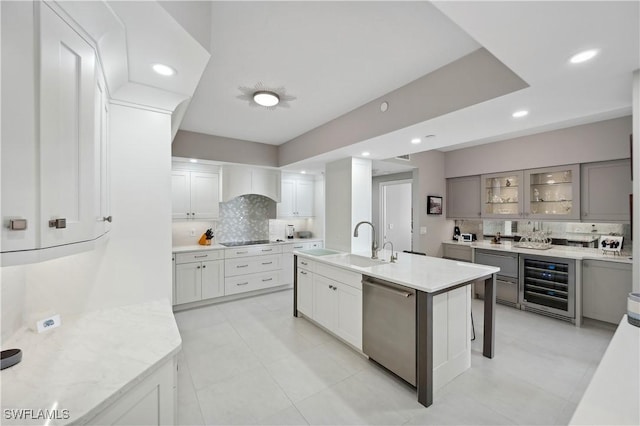
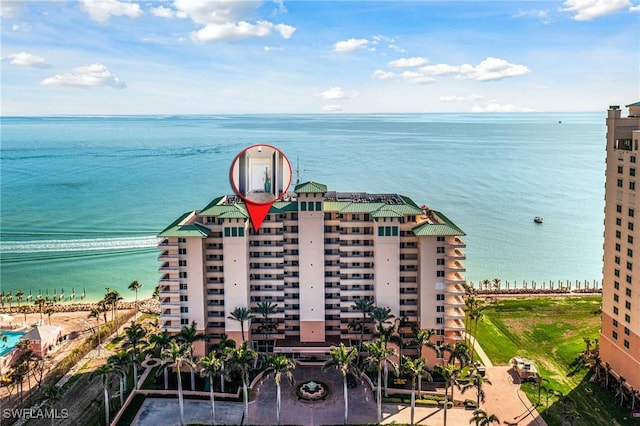
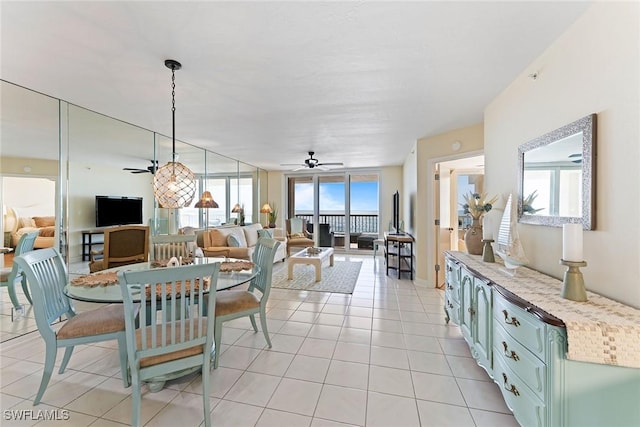
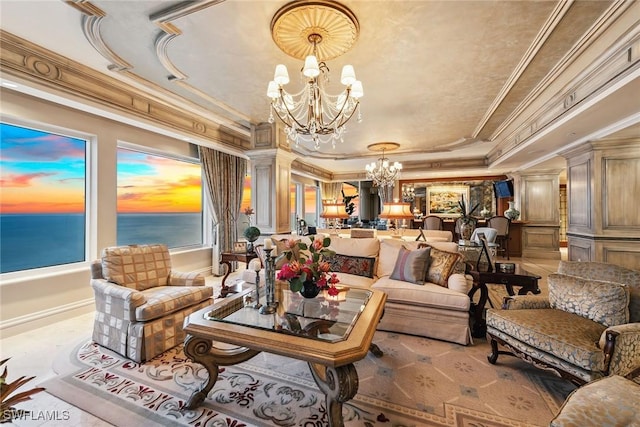
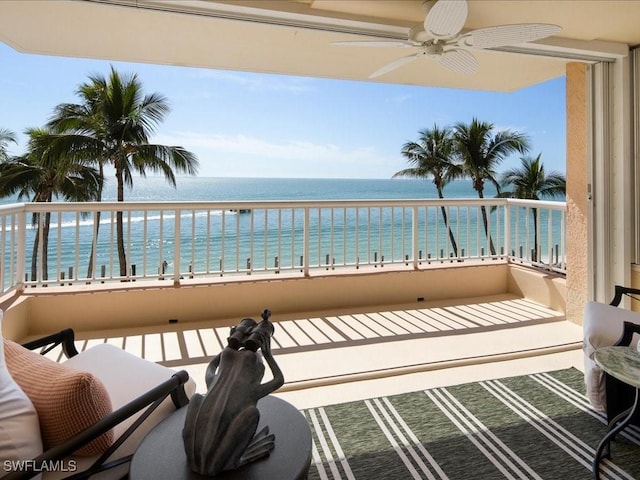
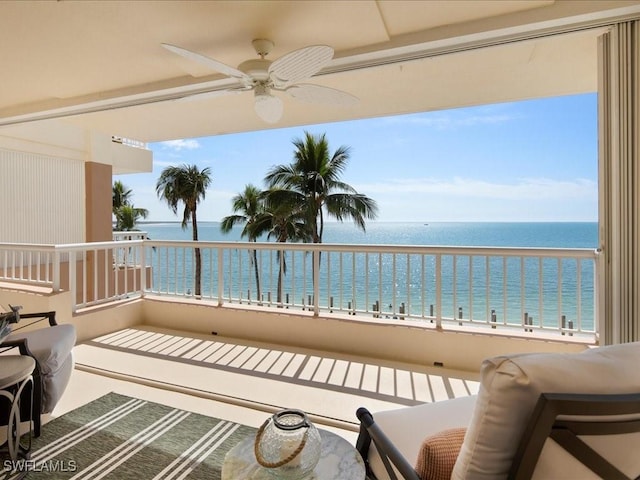
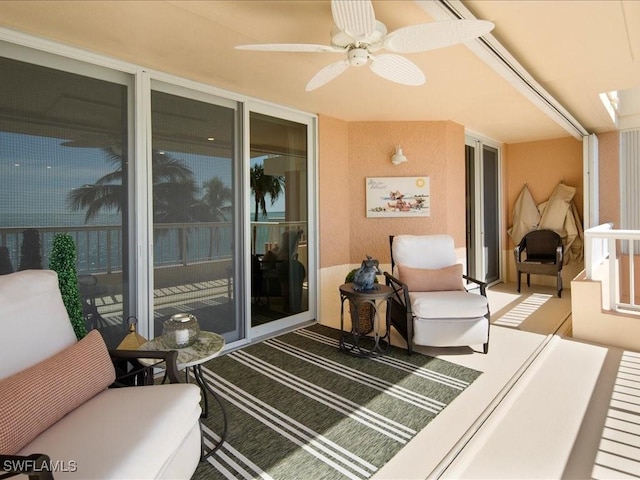
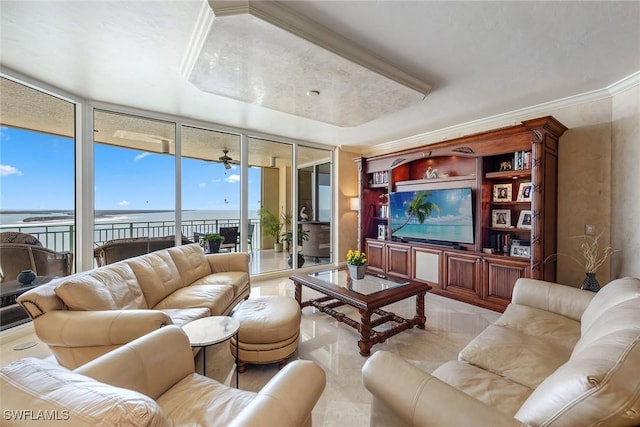
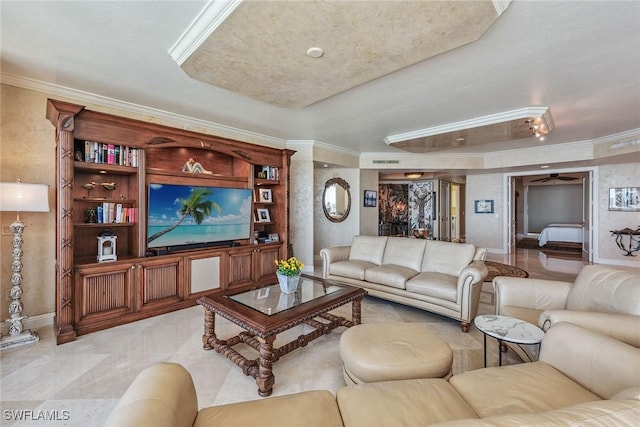
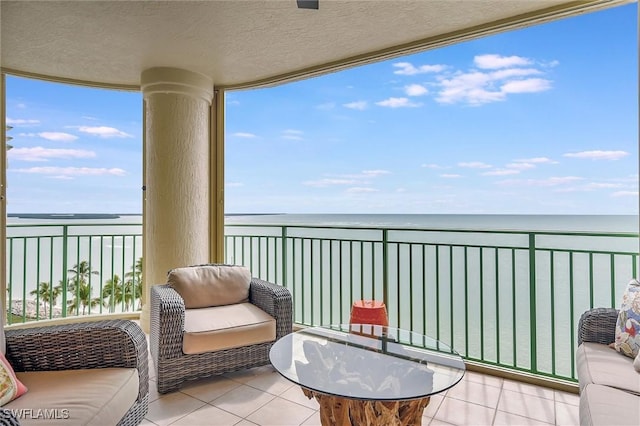
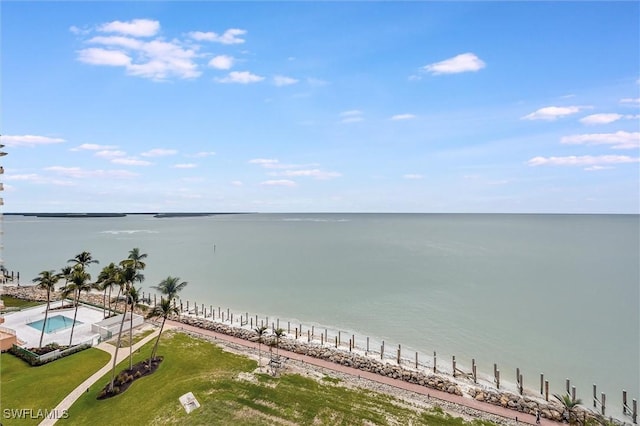
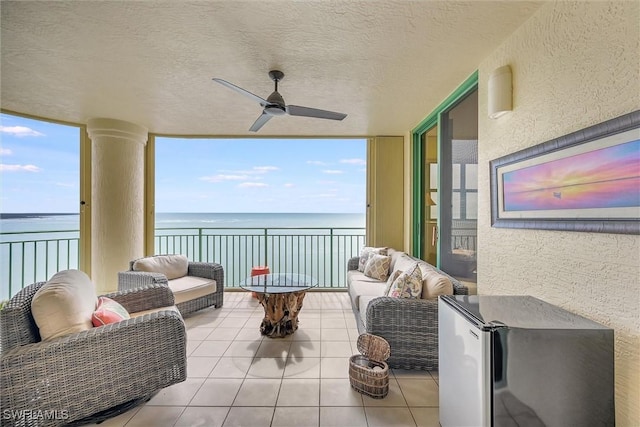
$10,000 Closing Credit¹
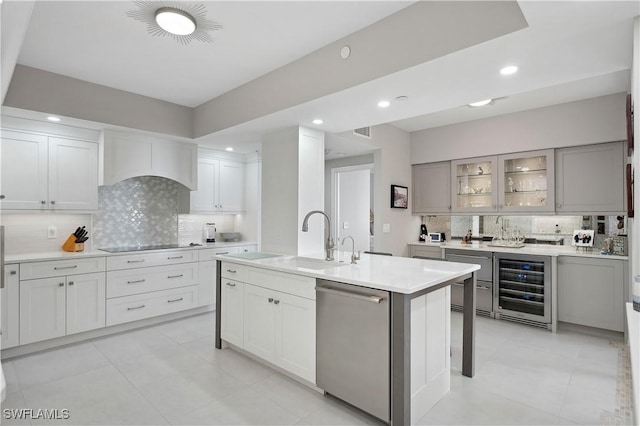
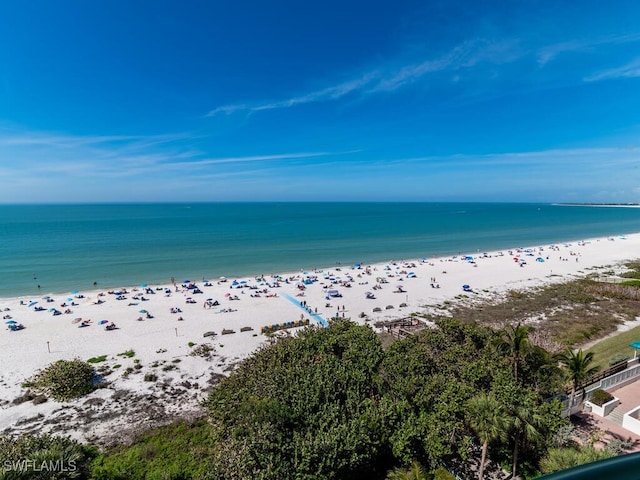
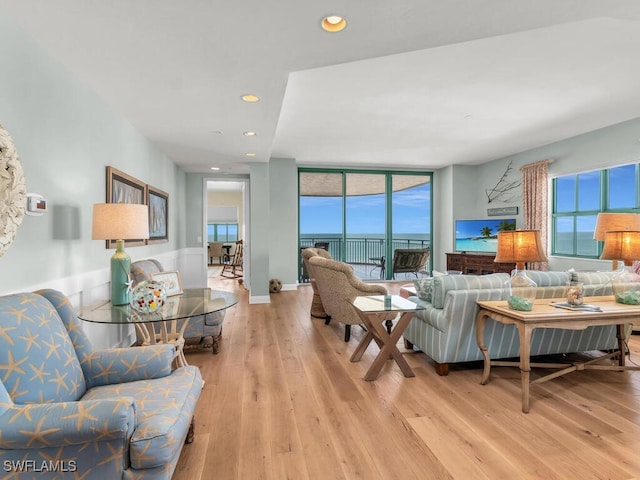
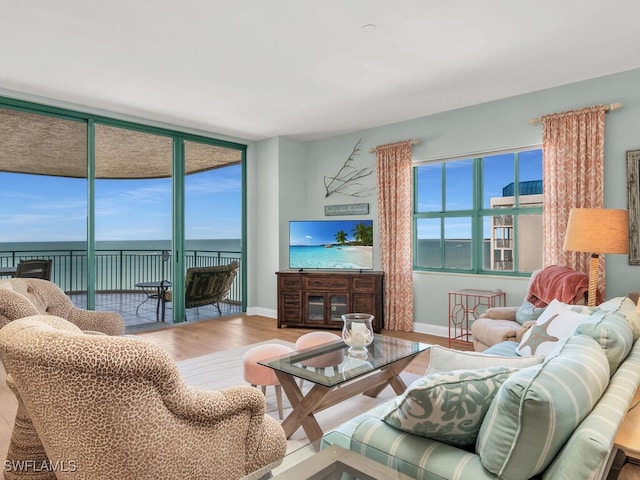
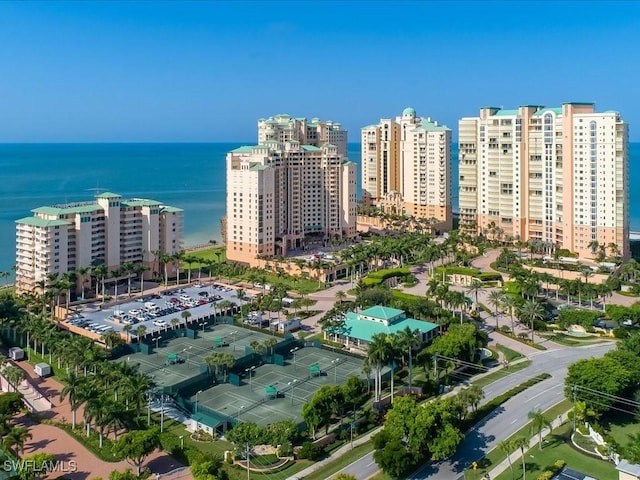
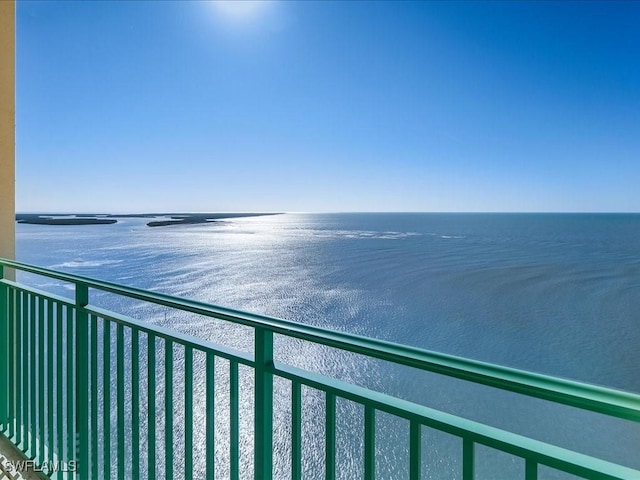
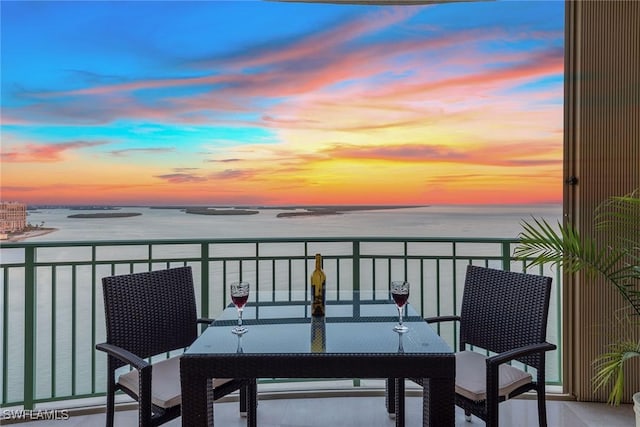
#225020620, Nick Sweat, Listing Office: Gulf Shore Properties SWFL


How much do homes in Cape Marco, FL cost?
Is Cape Marco, FL a buyer’s or seller’s market?
Seller'sMarket
Buyer'sMarket
Cape Marco is a Buyer's Market
Difference Since January 2025
Last month, Cape Marco has remained a Buyer's Market.
Cape Marco is a Buyers Housing Market, which means prices tend to be lower and homes stay on the market longer.
Based on all homes sold in February 2025
Homes in Cape Marco have sold for 54.8% more than they did a month ago.
Summary: The median home sold price in Cape Marco was $1,950,000 in February 2025, up 54.8% from last month, and the median price per square foot was $927.
| Beds | Jan 2025 | Feb 2025 | Change MoM |
|---|---|---|---|
| 11 Bedroom | - | - | N/A |
| 22 Bedrooms | - | - | N/A |
| 33 Bedrooms | $1.2M | $1.9M | +54.8% |
| 44 Bedrooms | - | - | N/A |
| 55+ Bedrooms | - | - | N/A |
Summary: Cape Marco housing price by bedroom type for February 2025, compared to the previous month. The home price for 1 bedroom homes did not change. The home price for 2 bedroom homes did not change. The home price for 3 bedroom homes increased by +54.8%. The home price for 4 bedroom homes did not change. The home price for 5 bedroom homes did not change.
Market comparison tool
Data and numbers shown are subject to change and may vary based on different timeframes.
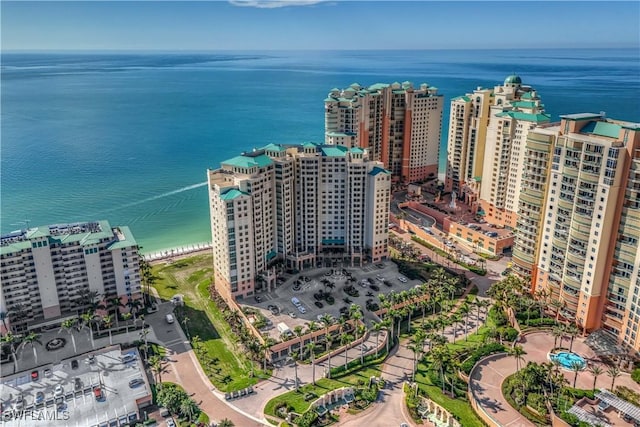
Cape Marco, FL
How many homes are available in Cape Marco, FL?
| Last Month | 2 months ago | Change MoM |
|---|---|---|
| 37Last MonthFeb 2025 | ||
| 332 months agoJan 2025 | +12.1 % Change MoMJan – Feb |
Summary: The Cape Marco real estate market had 37 homes for sale in Feb 2025, a 12.1 % increase compared to Jan 2025.
| Last Month | 2 months ago | Change MoM |
|---|---|---|
| 3Last MonthFeb 2025 | ||
| 22 months agoJan 2025 | +50.0 % Change MoMJan – Feb |
| Beds | Jan 2025 | Feb 2025 | Change MoM |
|---|---|---|---|
| 11 Bedroom | 0 | 0 | 0.0% |
| 22 Bedrooms | 4 | 7 | +75.0% |
| 33 Bedrooms | 23 | 24 | +4.3% |
| 44 Bedrooms | 5 | 4 | -20.0% |
| 55+ Bedrooms | 1 | 2 | +100.0% |
Summary: Cape Marco housing inventory by bedroom type for February 2025, compared to the previous month. The inventory for 1 bedroom homes remained the same. The inventory for 2 bedroom homes increased by +75.0%. The inventory for 3 bedroom homes increased by +4.3%. The inventory for 4 bedroom homes decreased by -20.0%. The inventory for 5 bedroom homes increased by +100.0%.
How much do homes in Cape Marco, FL cost?
Over Asking Price0 Home
At Asking Price0 Home
Under Asking Price3 Homes
If you're buying a home in Cape Marco, you may be able to get a good deal. 100% of homes here sold below asking price last month.
Summary: A total of 3 homes were sold or pending in Cape Marco in February 2025, up by 50.0% month-over-month. Of the 3 sold homes, 100% were sold under asking, 0% were sold at asking, and and 0% were sold over asking.
How long does it take to sell a home in Cape Marco, FL?
Under 30 Days1 Home
30 – 90 Days0 Home
Over 90 Days2 Homes
Most homes in Cape Marco are taking a long time to sell, it's a good idea to negotiate on homes here.
Summary: During February 2025, 3 homes were sold in Cape Marco; 33% of homes were sold within 30 days, 0% of homes were sold within 30 to 90 days, and 67% of homes were sold over 90 days.
| Last Month | 1 month ago | Change MoM |
|---|---|---|
| 220 DaysLast MonthFeb 2025 | ||
| 50 Days1 month agoJan 2025 | +340.7 % Change MoMJan – Feb |
Summary: Homes in Cape Marco had an average listing age of 220 days in Feb 2025, up by 340.7% compared to the previous month.
Connect With An Agent
Local real estate agents are ready to help you find a home here
Sell My Home
Sell your home with an expert or get the job done on your own.
Get Approved
Get a customizable mortgage solution based on today's rates.
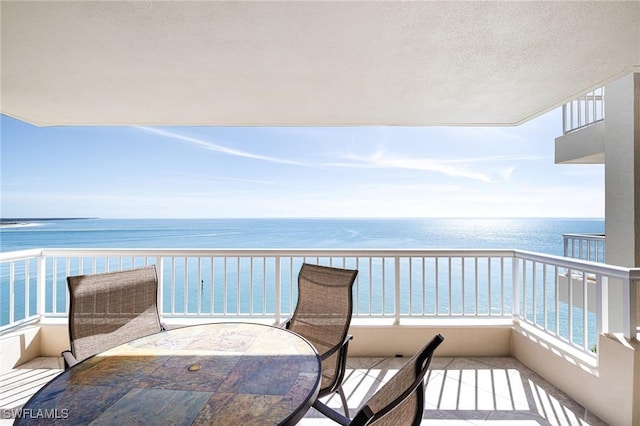
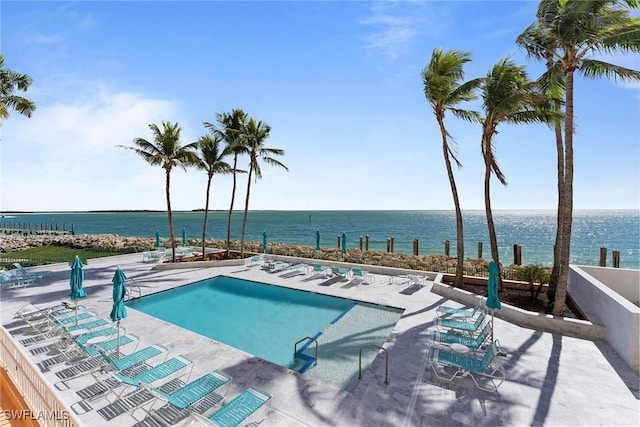
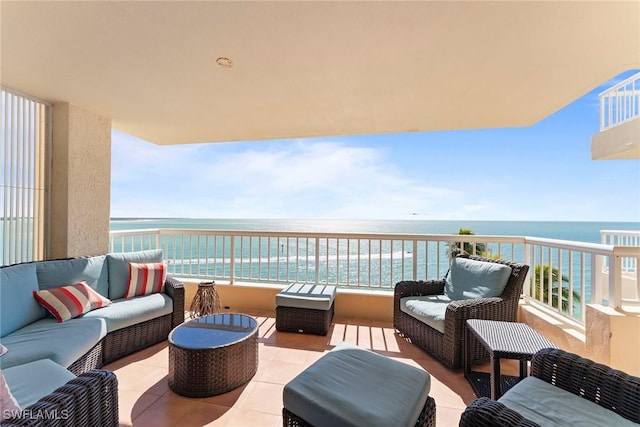
What homes are available in Cape Marco, FL?
#225020620, Nick Sweat, Listing Office: Gulf Shore Properties SWFL


#225021474, Natalie Kirstein, Listing Office: William Raveis Real Estate
#225017087, Annie Reist, Listing Office: Realty One Group MVP
#225015550, Richele Durbin, Listing Office: Berkshire Hathaway FL Realty
#225016204, Shari Fairchild, Listing Office: Anchor Real Estate

#225010003, Ralph Iorio, Listing Office: Achieve Realty LLC
#225013776, Cathy Rogers, Listing Office: Premier Sotheby's Int'l Realty


#225013570, Michelle Thomas, Listing Office: Premier Sotheby's Int'l Realty
#225013668, Tony Walter, Listing Office: Island Realty Marco

#225012767, Paul Tateo, Listing Office: Horizons by the Sea Inc
#225008862, James Prange, Listing Office: Premier Sotheby's Int'l Realty
#225010788, Tammi Vance, Listing Office: Re/Max Alliance Group
Nearby markets aren't available for Cape Marco, FL
Based on information from Florida Gulf Coast MLS, for the period 01/01/2025 - 03/01/2025
 The data relating to real estate for sale on this website comes in part from the Southwest Florida Multiple Listing Service. The information being provided is for consumers` personal, non-commercial use and may not be used for any purpose other than to identify prospective properties consumers may be interested in purchasing. Information has not been verified, is not guaranteed, and is subject to change. Real estate listings held by other brokerage firms other are marked with the IDX logo and detailed information about them includes the name of the listing brokers.