7 days on Rocket
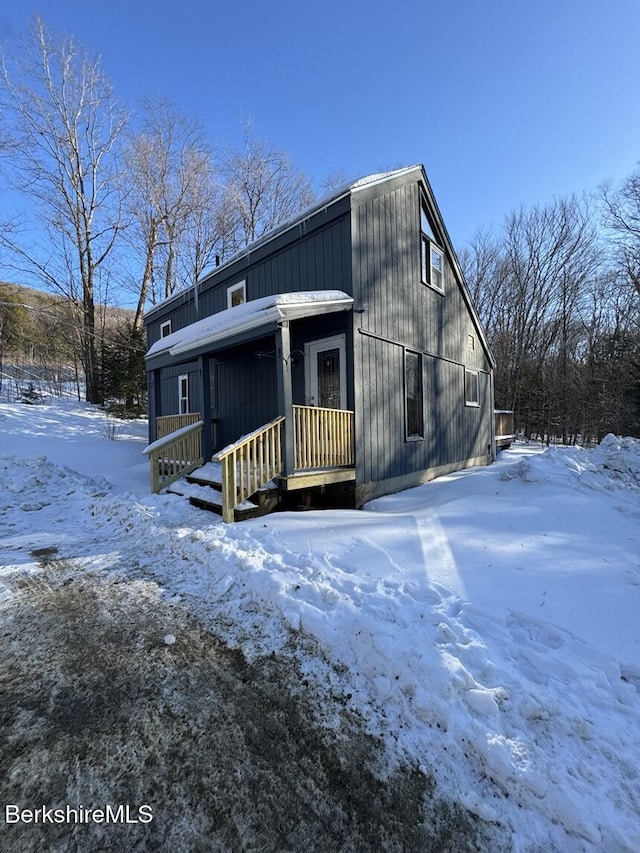
#247146, Allen Bassen, Listing office: BERKSHIRE HOMES AND CONDOS


How much do homes in Hancock, MA cost?
Is Hancock, MA a buyer’s or seller’s market?
Seller'sMarket
Buyer'sMarket
Hancock is a Buyer's Market
Difference Since May 2025
Last month, Hancock has remained a Buyer's Market.
Hancock is a Buyers Housing Market, which means prices tend to be lower and homes stay on the market longer.
Based on all homes sold in June 2025
Homes in Hancock have sold for 31% less than they did a month ago.
Summary: The median home sold price in Hancock was $202,500 in June 2025, down 31% from last month, and the median price per square foot was $292.
| City | May 2025 | Jun 2025 | Change MoM |
|---|---|---|---|
| New Lebanon | $325K | $250K | -23.1% |
| Hancock | $293.5K | $202.5K | -31.0% |
| Beds | May 2025 | Jun 2025 | Change MoM |
|---|---|---|---|
| 11 Bedroom | $125K | $150K | +20.0% |
| 22 Bedrooms | - | $255K | N/A |
| 33 Bedrooms | $462K | - | N/A |
| 44 Bedrooms | - | - | N/A |
| 55+ Bedrooms | - | - | N/A |
Summary: Hancock housing price by bedroom type for June 2025, compared to the previous month. The home price for 1 bedroom homes increased by +20.0%. The home price for 2 bedroom homes did not change. The home price for 3 bedroom homes did not change. The home price for 4 bedroom homes did not change. The home price for 5 bedroom homes did not change.
Market comparison tool
Data and numbers shown are subject to change and may vary based on different timeframes.
Hancock, MA
How many homes are available in Hancock, MA?
| Last Month | 2 months ago | Change MoM |
|---|---|---|
| 20Last MonthJun 2025 | ||
| 202 months agoMay 2025 | 0.0 % Change MoMMay – Jun |
Summary: The Hancock real estate market had 20 homes for sale in Jun 2025, the same as May 2025
| Last Month | 2 months ago | Change MoM |
|---|---|---|
| 2Last MonthJun 2025 | ||
| 22 months agoMay 2025 | 0.0 % Change MoMMay – Jun |
| Beds | May 2025 | Jun 2025 | Change MoM |
|---|---|---|---|
| 11 Bedroom | 6 | 6 | 0.0% |
| 22 Bedrooms | 7 | 7 | 0.0% |
| 33 Bedrooms | 5 | 5 | 0.0% |
| 44 Bedrooms | 1 | 1 | 0.0% |
| 55+ Bedrooms | 1 | 1 | 0.0% |
Summary: Hancock housing inventory by bedroom type for June 2025, compared to the previous month. The inventory for 1 bedroom homes remained the same. The inventory for 2 bedroom homes remained the same. The inventory for 3 bedroom homes remained the same. The inventory for 4 bedroom homes remained the same. The inventory for 5 bedroom homes remained the same.
How much do homes in Hancock, MA cost?
Over Asking Price0 Home
At Asking Price0 Home
Under Asking Price2 Homes
If you're buying a home in Hancock, you may be able to get a good deal. 100% of homes here sold below asking price last month.
Summary: A total of 2 homes were sold or pending in Hancock in June 2025, the same as the previous month. Of the 2 sold homes, 100% were sold under asking, 0% were sold at asking, and and 0% were sold over asking.
How long does it take to sell a home in Hancock, MA?
Under 30 Days0 Home
30 – 90 Days2 Homes
Over 90 Days0 Home
Avg time on Rocket Homes in Hancock has remained consistent over time.
Summary: During June 2025, 2 homes were sold in Hancock; 0% of homes were sold within 30 days, 100% of homes were sold within 30 to 90 days, and 0% of homes were sold over 90 days.
| Last Month | 1 month ago | Change MoM |
|---|---|---|
| 56 DaysLast MonthJun 2025 | ||
| 173 Days1 month agoMay 2025 | -67.6 % Change MoMMay – Jun |
Summary: Homes in Hancock had an average listing age of 56 days in Jun 2025, down by 67.6% compared to the previous month.
Connect With An Agent
Local real estate agents are ready to help you find a home here
Sell My Home
Sell your home with an expert or get the job done on your own.
Get Approved
Get a customizable mortgage solution based on today's rates.
What homes are available in Hancock, MA?
#247146, Allen Bassen, Listing office: BERKSHIRE HOMES AND CONDOS
#247112, Kevin F. Moderski, Listing office: JIMINY REALTY
#247069, Kevin F. Moderski, Listing office: JIMINY REALTY
#246863, Lisa Mendel, Listing office: BURNHAM GOLD REAL ESTATE, LLC
#246752, Kevin F. Moderski, Listing office: JIMINY REALTY
#246549, Colleen Zajac, Dennis J DArcangelo, Listing office: MONARCH REALTY, INC.
#73379506, Derek Greene, Listing office: The Greene Realty Group
#246385, Elle Villetto, Jared Kelly, Listing office: WILLIAM PITT SOTHEBYS - LENOX, WILLIAM PITT SOTHEBYS - GT BARRINGTON
#246382, Martha Pope, Listing office: BISHOP WEST REAL ESTATE
#245592, Kevin F. Moderski, Listing office: JIMINY REALTY
#245435, Kevin F. Moderski, Listing office: JIMINY REALTY
#244293, Deb Trzcinski, Listing office: STEEPLEVIEW REALTY - ADAMS BRANCH
Nearby markets aren't available for Hancock, MA
Based on information from Berkshire County Multiple Listing Service, and MLS Property Information Network Inc. for the period 05/01/2025 - 07/01/2025
 Disclaimer: The property listing data and information set forth herein were provided to MLS Property Information Network, Inc. from third party sources, including sellers, lessors and public records, and were compiled by MLS Property Information Network, Inc. The property listing data and information are for the personal, non commercial use of consumers having a good faith interest in purchasing or leasing listed properties of the type displayed to them and may not be used for any purpose other than to identify prospective properties which such consumers may have a good faith interest in purchasing or leasing. MLS Property Information Network, Inc. and its subscribers disclaim any and all representations and warranties as to the accuracy of the property listing data and information set forth herein. We may make use of information provided by users of this website - see our Terms of Use for more details on our privacy policy.