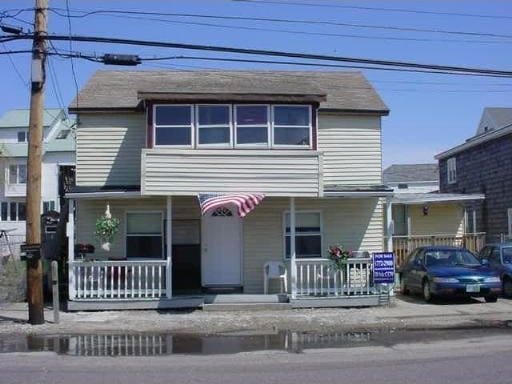
18 hours on Rocket
#73407705, Joe Armano, Listing office: Century 21 North East


How much do homes in Salisbury, MA cost?
Is Salisbury, MA a buyer’s or seller’s market?
Seller'sMarket
Buyer'sMarket
Salisbury is a Seller's Market
Difference Since June 2024
Since last year, Salisbury has remained a Seller's Market.
Salisbury is a Sellers Housing Market, which means prices tend to be higher and homes sell faster.
Based on all homes sold in the last 12 months
Homes in Salisbury have sold for 10.4% more than they did a year ago.
Summary: The median home sold price in Salisbury was $652,500 in June 2025, up 10.4% from last year, and the median price per square foot was $380.
| City | Jun 2024 | Jun 2025 | Change YoY |
|---|---|---|---|
| Salisbury | $591K | $652.5K | +10.4% |
| Amesbury | $555K | $607.5K | +9.5% |
| Amesbury Town | $555K | $607.5K | +9.5% |
| Newburyport | $825K | $899K | +9.0% |
| Beds | Jun 2024 | Jun 2025 | Change YoY |
|---|---|---|---|
| 11 Bedroom | $271K | $349.9K | +29.1% |
| 22 Bedrooms | $469K | $510K | +8.7% |
| 33 Bedrooms | $605K | $740K | +22.3% |
| 44 Bedrooms | $710K | $760K | +7.0% |
| 55+ Bedrooms | $785.3K | $991K | +26.2% |
Summary: Salisbury housing price by bedroom type for June 2025, compared to the previous year. The home price for 1 bedroom homes increased by +29.1%. The home price for 2 bedroom homes increased by +8.7%. The home price for 3 bedroom homes increased by +22.3%. The home price for 4 bedroom homes increased by +7.0%. The home price for 5 bedroom homes increased by +26.2%.
Market comparison tool
Data and numbers shown are subject to change and may vary based on different timeframes.
Salisbury, MA
How many homes are available in Salisbury, MA?
| Last Month | 2 months ago | Change MoM |
|---|---|---|
| 59Last MonthJun 2025 | ||
| 442 months agoMay 2025 | +34.1 % Change MoMMay – Jun |
Summary: The Salisbury real estate market had 59 homes for sale in Jun 2025, a 34.1 % increase compared to May 2025.
| Last Month | 2 months ago | Change MoM |
|---|---|---|
| 12Last MonthJun 2025 | ||
| 82 months agoMay 2025 | +50.0 % Change MoMMay – Jun |
| Beds | May 2025 | Jun 2025 | Change MoM |
|---|---|---|---|
| 11 Bedroom | 1 | 1 | 0.0% |
| 22 Bedrooms | 9 | 16 | +77.8% |
| 33 Bedrooms | 13 | 20 | +53.8% |
| 44 Bedrooms | 11 | 10 | -9.1% |
| 55+ Bedrooms | 10 | 12 | +20.0% |
Summary: Salisbury housing inventory by bedroom type for June 2025, compared to the previous month. The inventory for 1 bedroom homes remained the same. The inventory for 2 bedroom homes increased by +77.8%. The inventory for 3 bedroom homes increased by +53.8%. The inventory for 4 bedroom homes decreased by -9.1%. The inventory for 5 bedroom homes increased by +20.0%.
How much do homes in Salisbury, MA cost?
Over Asking Price7 Homes
At Asking Price2 Homes
Under Asking Price3 Homes
If you're buying a home in Salisbury, you could pay more than the asking price. 58.3% of homes here sold above asking price last month.
Summary: A total of 12 homes were sold or pending in Salisbury in June 2025, up by 50.0% month-over-month. Of the 12 sold homes, 25% were sold under asking, 17% were sold at asking, and and 58% were sold over asking.
How long does it take to sell a home in Salisbury, MA?
Under 30 Days9 Homes
30 – 90 Days3 Homes
Over 90 Days0 Home
Many homes in Salisbury are selling fast, if you're buying plan to act quickly.
Summary: During June 2025, 12 homes were sold in Salisbury; 75% of homes were sold within 30 days, 25% of homes were sold within 30 to 90 days, and 0% of homes were sold over 90 days.
| This Year | 1 year ago | Change YoY |
|---|---|---|
| 25 DaysThis YearJun 2025 | ||
| 25 Days1 year agoJun 2024 | 0.2 % Change YoYJun 2024 – Jun 2025 |
Summary: Homes in Salisbury had an average listing age of 25 days in Jun 2025, down by .2% compared to the previous year.
Connect With An Agent
Local real estate agents are ready to help you find a home here
Sell My Home
Sell your home with an expert or get the job done on your own.
Get Approved
Get a customizable mortgage solution based on today's rates.
What homes are available in Salisbury, MA?
#73407705, Joe Armano, Listing office: Century 21 North East
#73407199, Janis Annese, Listing office: Monarch Property Group, LLC
#73406513, Gina Pearson, Listing office: Diamond Key Real Estate
#73406278, Louise Lingerman, Listing office: Realty One Group Nest
#73405252, Brian Cossette, Listing office: RE/MAX Bentley's
#73404852, Brooke Soucie, Listing office: Bentley By The Sea Inc.
#73404481, Justin Haley, Listing office: Compass
#73402832, Jennifer Charos, Listing office: Advisors Living - Merrimac
#73401186, Elizabeth Smith, Listing office: Keller Williams Realty Evolution
#73400870, Cathy Toomey, Listing office: Lamacchia Realty, Inc.

#73389611, Zhuoming Sun, Listing office: Larkin & Larkin Real Estate
#73397090, Jack Mahoney, Listing office: RE/MAX Bentley's
Based on information from MLS Property Information Network Inc., and PrimeMLS for the period 07/01/2023 - 07/01/2025
 Disclaimer: The property listing data and information set forth herein were provided to MLS Property Information Network, Inc. from third party sources, including sellers, lessors and public records, and were compiled by MLS Property Information Network, Inc. The property listing data and information are for the personal, non commercial use of consumers having a good faith interest in purchasing or leasing listed properties of the type displayed to them and may not be used for any purpose other than to identify prospective properties which such consumers may have a good faith interest in purchasing or leasing. MLS Property Information Network, Inc. and its subscribers disclaim any and all representations and warranties as to the accuracy of the property listing data and information set forth herein. We may make use of information provided by users of this website - see our Terms of Use for more details on our privacy policy.
 © Copyright 2025 PrimeMLS, Inc. All rights reserved. This information is deemed reliable, but not guaranteed. The data relating to real estate displayed on this site comes in part from the IDX Program of PrimeMLS. The information being provided is for consumers’ personal, non-commercial use and may not be used for any purpose other than to identify prospective properties consumers may be interested in purchasing.