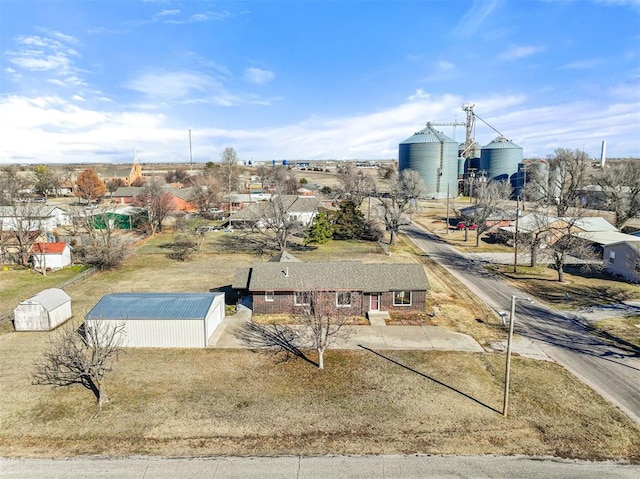
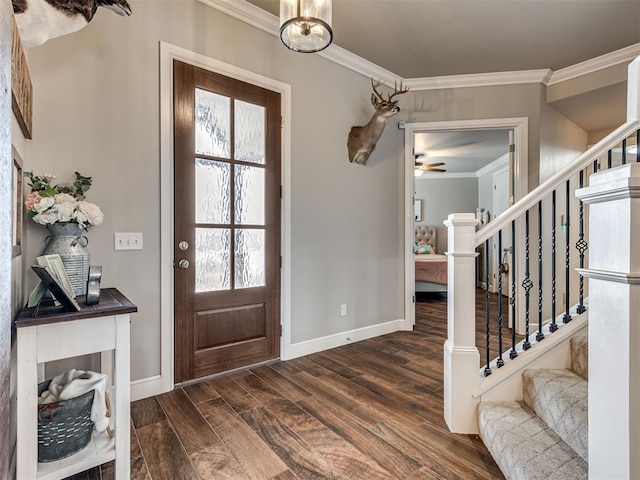
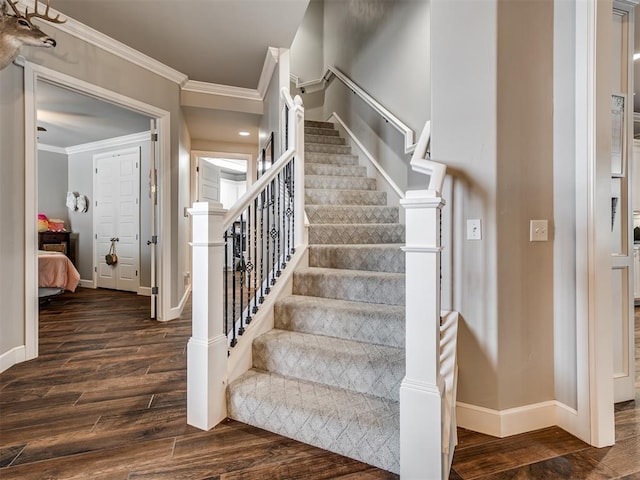
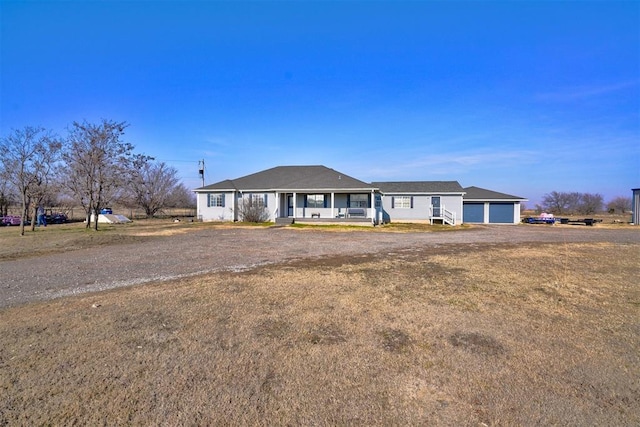
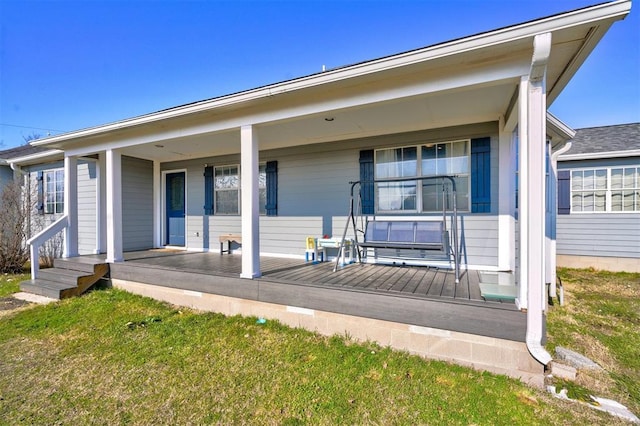
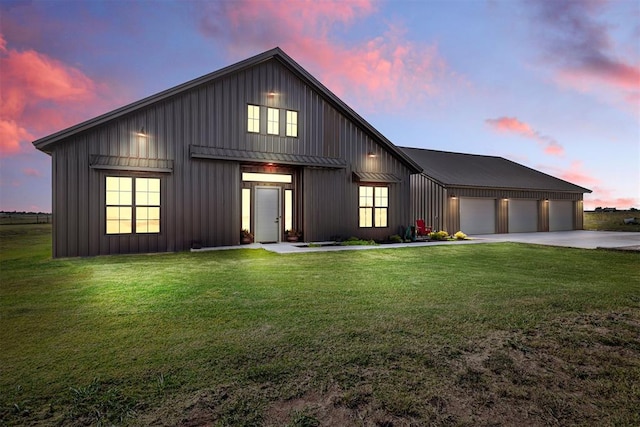
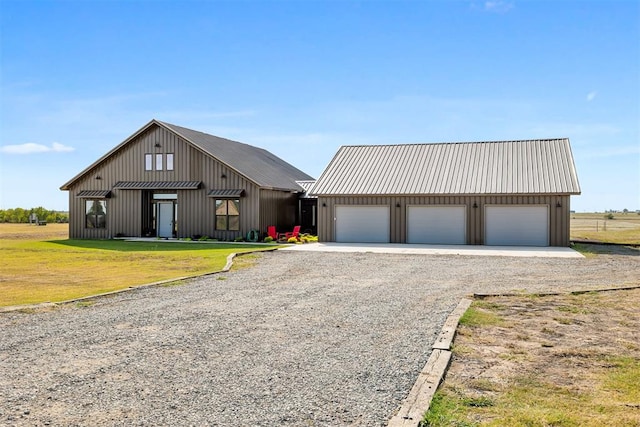
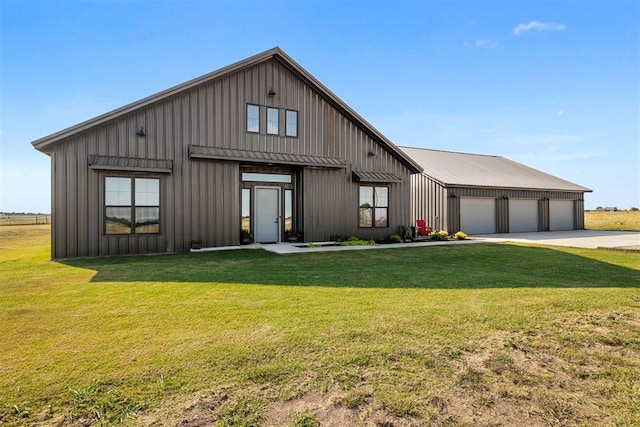
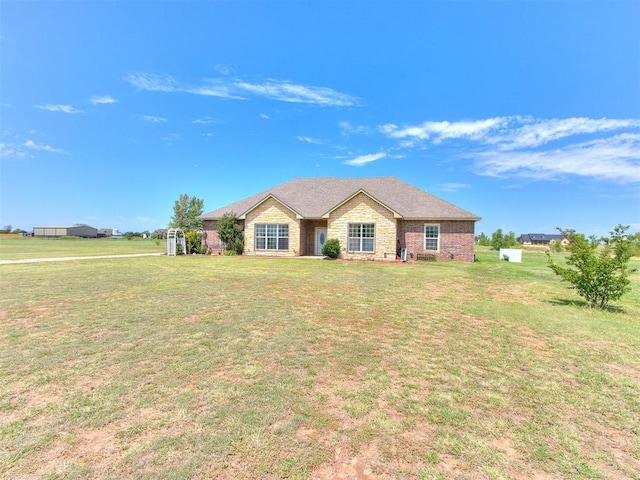
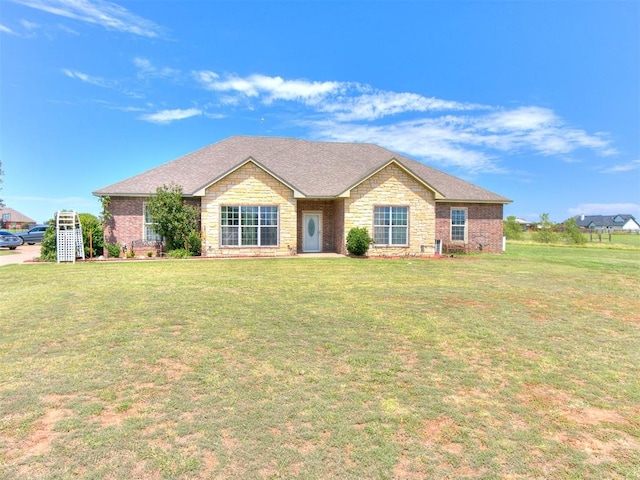
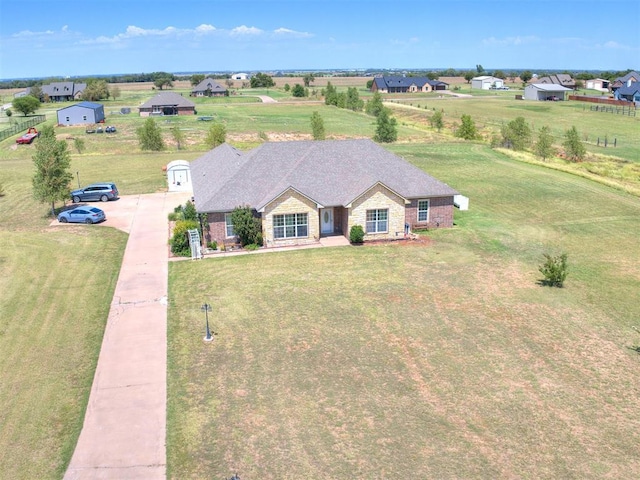
Video tour
$1,483 Closing Credit¹

#1153796, Casey N. Trejo, Listing Office: Cultivate Real Estate


How much do homes in Union City, OK cost?
Is Union City, OK a buyer’s or seller’s market?
Seller'sMarket
Buyer'sMarket
Union City is a Neutral Market
Difference Since December 2024
Last month, Union City was a Seller's Market.
Union City is a Neutral Housing Market, which means prices tend to be reasonable and homes stay on the market for a typical length of time.
Based on all homes sold in January 2025
Homes in Union City have sold for 42.4% less than they did a month ago.
Summary: The median home sold price in Union City was $130,000 in January 2025, down 42.4% from last month, and the median price per square foot was $116.
| City | Dec 2024 | Jan 2025 | Change YoY |
|---|---|---|---|
| Union City | $225.5K | $130K | -42.4% |
| Minco | $215K | $50K | -76.7% |
| Beds | Dec 2024 | Jan 2025 | Change YoY |
|---|---|---|---|
| 11 Bedroom | - | - | N/A |
| 22 Bedrooms | $398K | - | N/A |
| 33 Bedrooms | $150.2K | $130K | -13.5% |
| 44 Bedrooms | - | - | N/A |
| 55+ Bedrooms | $285K | - | N/A |
Summary: Union City housing price by bedroom type for January 2025, compared to the previous year. The home price for 1 bedroom homes did not change. The home price for 2 bedroom homes did not change. The home price for 3 bedroom homes decreased by -13.5%. The home price for 4 bedroom homes did not change. The home price for 5 bedroom homes did not change.
How many homes are available in Union City, OK?
| Last Month | 2 months ago | Change MoM |
|---|---|---|
| 7Last MonthJan 2025 | ||
| 102 months agoDec 2024 | -30.0 % Change MoMDec – Jan |
Summary: The Union City real estate market had 7 homes for sale in Jan 2025, a 30.0 % decrease compared to Dec 2024.
| Last Month | 2 months ago | Change MoM |
|---|---|---|
| 1Last MonthJan 2025 | ||
| 42 months agoDec 2024 | -75.0 % Change MoMDec – Jan |
| Beds | Dec 2024 | Jan 2025 | Change MoM |
|---|---|---|---|
| 11 Bedroom | 0 | 0 | 0.0% |
| 22 Bedrooms | 1 | 0 | -100.0% |
| 33 Bedrooms | 4 | 1 | -75.0% |
| 44 Bedrooms | 2 | 3 | +50.0% |
| 55+ Bedrooms | 3 | 3 | 0.0% |
Summary: Union City housing inventory by bedroom type for January 2025, compared to the previous month. The inventory for 1 bedroom homes remained the same. The inventory for 2 bedroom homes decreased by -100.0%. The inventory for 3 bedroom homes decreased by -75.0%. The inventory for 4 bedroom homes increased by +50.0%. The inventory for 5 bedroom homes remained the same.
How much do homes in Union City, OK cost?
Over Asking Price0 Home
At Asking Price1 Home
Under Asking Price0 Home
If you're buying a home in Union City, expect to pay close to the asking price. 100% of homes here sold near the asking price last month.
Summary: A total of 1 homes were sold or pending in Union City in January 2025, down by 75.0% month-over-month. Of the 1 sold homes, 0% were sold under asking, 100% were sold at asking, and and 0% were sold over asking.
How long does it take to sell a home in Union City, OK?
Under 30 Days0 Home
30 – 90 Days1 Home
Over 90 Days0 Home
Avg time on Rocket Homes in Union City has remained consistent over time.
Summary: During January 2025, 1 homes were sold in Union City; 0% of homes were sold within 30 days, 100% of homes were sold within 30 to 90 days, and 0% of homes were sold over 90 days.
| Last Month | 1 month ago | Change MoM |
|---|---|---|
| 46 DaysLast MonthJan 2025 | ||
| 12 Days1 month agoDec 2024 | +268.0 % Change MoMDec – Jan |
Summary: Homes in Union City had an average listing age of 46 days in Jan 2025, up by 268.0% compared to the previous month.
Connect With An Agent
Local real estate agents are ready to help you find a home here
Sell My Home
Sell your home with an expert or get the job done on your own.
Get Approved
Get a customizable mortgage solution based on today's rates.
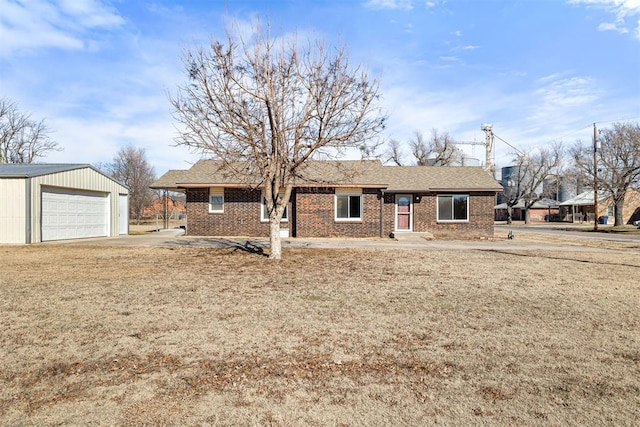
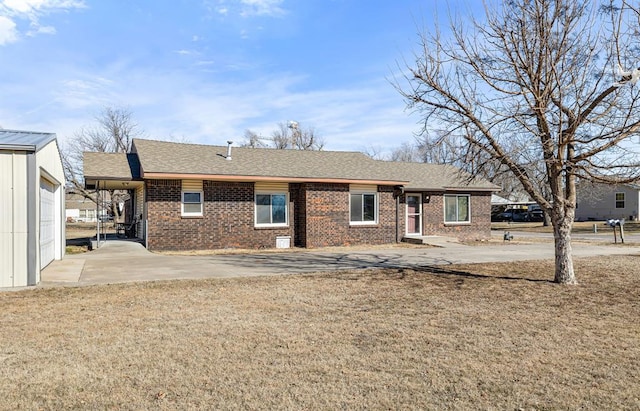
What homes are available in Union City, OK?
#1153796, Casey N. Trejo, Listing Office: Cultivate Real Estate
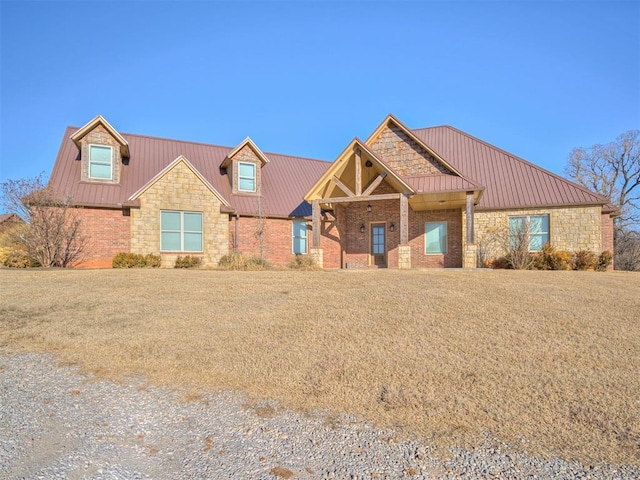
#1149780, Brian Jamison, Listing Office: Salt Real Estate Inc
#1149378, Aubrey Roberts, Listing Office: The Real Estate Lab, LLC
#1141959, Brian Jamison, Listing Office: Salt Real Estate Inc
#1139040, Seth Koenig, Listing Office: Pioneer Realty


#1137885, Seth Koenig, Listing Office: Pioneer Realty
#1133890, Jessica L. Harris, Listing Office: Realty ONE Group Champion
#1130842, Joseph McKamie, Listing Office: Copper Creek Real Estate


#1108776, Ken Carpenter, Listing Office: Ken Carpenter Realty


#1063853, Kristy Stevens, Listing Office: RE/MAX Realty Plus Inc

#1043670, Ken Carpenter, Listing Office: Ken Carpenter Realty
Based on information from MLS of Oklahoma, for the period 12/01/2024 - 02/01/2025
 Copyright© 2025 MLSOK, Inc. All rights reserved. Certain information contained herein is derived from information which is the licensed property of, and copyrighted by, MLSOK, Inc. We do not attempt to independently verify the currency, completeness, accuracy or authenticity of the data contained herein. It may be subject to transcription and transmission errors. Accordingly, the data is provided as is, as available basis only and may not reflect all real estate activity in the market. The information on this web site is provided exclusively for consumers' personal, non-commercial use and may not be used for any purpose other than to identify prospective properties consumers may be interested in purchasing.