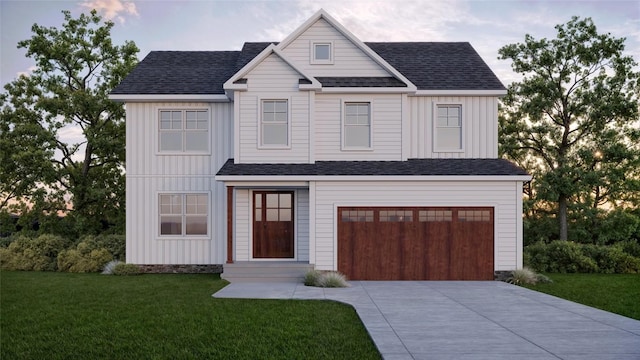
16 hours on Rocket
#185916, Listing office: RE/MAX Real Estate Group East


How much do homes in Harborcreek Township, PA cost?
Is Harborcreek Township, PA a buyer’s or seller’s market?
Seller'sMarket
Buyer'sMarket
Harborcreek Township is a Seller's Market
Difference Since June 2024
Since last year, Harborcreek Township has remained a Seller's Market.
Harborcreek Township is a Sellers Housing Market, which means prices tend to be higher and homes sell faster.
Based on all homes sold in the last 12 months
Homes in Harborcreek Township have sold for 12.9% more than they did a year ago.
Summary: The median home sold price in Harborcreek Township was $275,475 in June 2025, up 12.9% from last year, and the median price per square foot was $177.
| City | Jun 2024 | Jun 2025 | Change YoY |
|---|---|---|---|
| Harborcreek Township | $244K | $275.4K | +12.9% |
| Lawrence Park Township | $160.2K | $160K | -0.2% |
| Beds | Jun 2024 | Jun 2025 | Change YoY |
|---|---|---|---|
| 11 Bedroom | - | $105K | N/A |
| 22 Bedrooms | $224.9K | $155K | -31.1% |
| 33 Bedrooms | $235K | $265K | +12.8% |
| 44 Bedrooms | $258.7K | $326.5K | +26.2% |
| 55+ Bedrooms | $327K | $345K | +5.5% |
Summary: Harborcreek Township housing price by bedroom type for June 2025, compared to the previous year. The home price for 1 bedroom homes did not change. The home price for 2 bedroom homes decreased by -31.1%. The home price for 3 bedroom homes increased by +12.8%. The home price for 4 bedroom homes increased by +26.2%. The home price for 5 bedroom homes increased by +5.5%.
Market comparison tool
Data and numbers shown are subject to change and may vary based on different timeframes.
Harborcreek Township, PA
How many homes are available in Harborcreek Township, PA?
| Last Month | 2 months ago | Change MoM |
|---|---|---|
| 36Last MonthJun 2025 | ||
| 382 months agoMay 2025 | -5.3 % Change MoMMay – Jun |
Summary: The Harborcreek Township real estate market had 36 homes for sale in Jun 2025, a 5.3 % decrease compared to May 2025.
| Last Month | 2 months ago | Change MoM |
|---|---|---|
| 13Last MonthJun 2025 | ||
| 132 months agoMay 2025 | 0.0 % Change MoMMay – Jun |
| Beds | May 2025 | Jun 2025 | Change MoM |
|---|---|---|---|
| 11 Bedroom | 0 | 0 | 0.0% |
| 22 Bedrooms | 3 | 2 | -33.3% |
| 33 Bedrooms | 22 | 19 | -13.6% |
| 44 Bedrooms | 12 | 13 | +8.3% |
| 55+ Bedrooms | 1 | 2 | +100.0% |
Summary: Harborcreek Township housing inventory by bedroom type for June 2025, compared to the previous month. The inventory for 1 bedroom homes remained the same. The inventory for 2 bedroom homes decreased by -33.3%. The inventory for 3 bedroom homes decreased by -13.6%. The inventory for 4 bedroom homes increased by +8.3%. The inventory for 5 bedroom homes increased by +100.0%.
How much do homes in Harborcreek Township, PA cost?
Over Asking Price6 Homes
At Asking Price1 Home
Under Asking Price6 Homes
If you're buying a home in Harborcreek Township, you may be able to get a good deal. 46.2% of homes here sold below asking price last month.
Summary: A total of 13 homes were sold or pending in Harborcreek Township in June 2025, the same as the previous month. Of the 13 sold homes, 46% were sold under asking, 8% were sold at asking, and and 46% were sold over asking.
How long does it take to sell a home in Harborcreek Township, PA?
Under 30 Days7 Homes
30 – 90 Days1 Home
Over 90 Days5 Homes
Many homes in Harborcreek Township are selling fast, if you're buying plan to act quickly.
Summary: During June 2025, 13 homes were sold in Harborcreek Township; 54% of homes were sold within 30 days, 8% of homes were sold within 30 to 90 days, and 38% of homes were sold over 90 days.
| This Year | 1 year ago | Change YoY |
|---|---|---|
| 93 DaysThis YearJun 2025 | ||
| 37 Days1 year agoJun 2024 | +153.2 % Change YoYJun 2024 – Jun 2025 |
Summary: Homes in Harborcreek Township had an average listing age of 93 days in Jun 2025, up by 153.2% compared to the previous year.
Connect With An Agent
Local real estate agents are ready to help you find a home here
Sell My Home
Sell your home with an expert or get the job done on your own.
Get Approved
Get a customizable mortgage solution based on today's rates.
What homes are available in Harborcreek Township, PA?
#185916, Listing office: RE/MAX Real Estate Group East
#185884, Listing office: Coldwell Banker Select - Airport
#1711510, Kimberly Cannon, Listing office: Your Town Realty Llc
#185842, Listing office: RE/MAX Real Estate Group East

#185831, Listing office: Howard Hanna Erie East
#1711062, Corey Barbato, Listing office: Keller Williams Realty

#185759, Listing office: Howard Hanna Erie East
#185638, Listing office: Maleno Real Estate
#185564, Listing office: Marsha Marsh RES Peach
#185565, Listing office: Howard Hanna Erie East
#185554, Listing office: Coldwell Banker Select - Peach
#184535, Listing office: RE/MAX Real Estate Group Erie
Based on information from Erie MLS, and West Penn Multi-List Inc. for the period 07/01/2023 - 07/01/2025
 The multiple listing information is provided by West Penn Multi-List, Inc. Information deemed reliable, but not guaranteed. IDX info provided exclusively for consumers’ personal, non-commercial use and may not be used for any purpose other than to identify prospective properties consumers may be interested in purchasing. All properties are subject to prior sale, change, or withdrawal. Listings displaying the IDX logo belong to brokers other than this broker. Neither the listing broker(s) nor this broker or the MLS shall be responsible for any typographical errors, misinformation, misprints, and shall be held totally harmless.