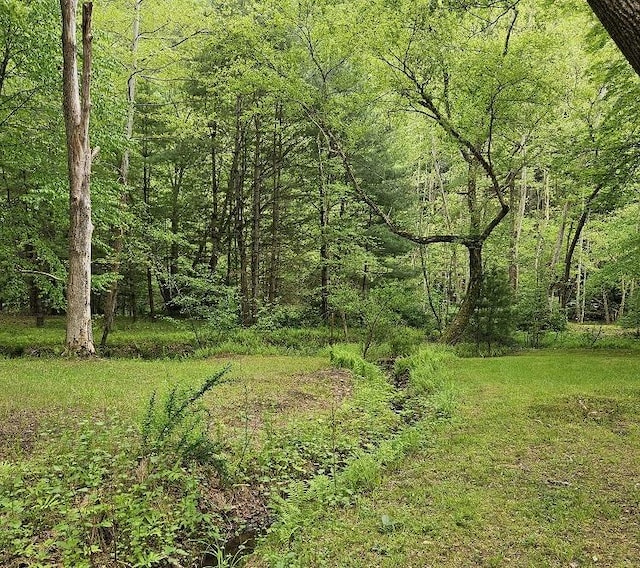
6 days on Rocket
#WB-102038, Listing office: DAVIS REAL ESTATE INC.


How much do homes in Waterville, PA cost?
Based on all homes listed in June 2025
The list price of homes in Waterville has remained the same since May.
Summary: The median home list price in Waterville was $367,350 in June 2025, the same as the previous month, and the median price per square foot was $230.
| City | May 2025 | Jun 2025 | Change MoM |
|---|---|---|---|
| Cummings Township | $367.3K | $367.3K | 0.0% |
| Waterville | $367.3K | $367.3K | 0.0% |
| Beds | May 2025 | Jun 2025 | Change MoM |
|---|---|---|---|
| 11 Bedroom | $44.5K | $44.5K | 0.0% |
| 22 Bedrooms | $367.3K | $367.3K | 0.0% |
| 33 Bedrooms | $399.4K | $399.4K | 0.0% |
| 44 Bedrooms | $590K | $590K | 0.0% |
| 55+ Bedrooms | - | - | N/A |
Summary: Waterville housing price by bedroom type for June 2025, compared to the previous month. The home price for 1 bedroom homes did not change. The home price for 2 bedroom homes did not change. The home price for 3 bedroom homes did not change. The home price for 4 bedroom homes did not change. The home price for 5 bedroom homes did not change.
Market comparison tool
Data and numbers shown are subject to change and may vary based on different timeframes.
Waterville, PA
How many homes are available in Waterville, PA?
| Last Month | 2 months ago | Change MoM |
|---|---|---|
| 6Last MonthJun 2025 | ||
| 62 months agoMay 2025 | 0.0 % Change MoMMay – Jun |
Summary: The Waterville real estate market had 6 homes for sale in Jun 2025, the same as May 2025
| Beds | May 2025 | Jun 2025 | Change MoM |
|---|---|---|---|
| 11 Bedroom | 1 | 1 | 0.0% |
| 22 Bedrooms | 2 | 2 | 0.0% |
| 33 Bedrooms | 2 | 2 | 0.0% |
| 44 Bedrooms | 1 | 1 | 0.0% |
| 55+ Bedrooms | 0 | 0 | 0.0% |
Summary: Waterville housing inventory by bedroom type for June 2025, compared to the previous month. The inventory for 1 bedroom homes remained the same. The inventory for 2 bedroom homes remained the same. The inventory for 3 bedroom homes remained the same. The inventory for 4 bedroom homes remained the same. The inventory for 5 bedroom homes remained the same.
How long does it take to sell a home in Waterville, PA?
| Last Month | 1 month ago | Change MoM |
|---|---|---|
| 83 DaysLast MonthJun 2025 | ||
| 58 Days1 month agoMay 2025 | +42.5 % Change MoMMay – Jun |
Summary: Homes in Waterville had an average listing age of 83 days in Jun 2025, up by 42.5% compared to the previous month.
Connect With An Agent
Local real estate agents are ready to help you find a home here
Sell My Home
Sell your home with an expert or get the job done on your own.
Get Approved
Get a customizable mortgage solution based on today's rates.
What homes are available in Waterville, PA?
#WB-102038, Listing office: DAVIS REAL ESTATE INC.
#WB-102029, Listing office: DAVIS REAL ESTATE INC.
#WB-101156, Listing office: RE/Max Bridges
#20-99849, LISE MARGARET BARRICK, Listing office: RE/MAX BRIDGES
#WB-101117, Listing office: Berkshire Hathaway HomeServices Hodrick Realty, WPT
#WB-100959, Listing office: DAVIS REAL ESTATE INC.
#31717632, Lisa Linn, Listing office: Davis Real Estate, Inc.
Nearby markets aren't available for Waterville, PA
Based on information from West Branch Valley Association of Realtors MLS, Central Susquehanna Valley Board of Realtors MLS, and Northern Mountains of Pennsylvania MLS for the period 05/01/2025 - 07/01/2025
 Information is provided by Northern Mountains of Pennsylvania MLS. Information deemed reliable but not guaranteed. All properties are subject to prior sale, change or withdrawal. Listing(s) information is provided exclusively for consumers' personal, non-commercial use and may not be used for any purpose other than to identify prospective properties consumers may be interested in purchasing. Copyright © 2025 Northern Mountains of Pennsylvania MLS. All rights reserved.